by David Schwalenberg
August 6, 2015

The most effective way to detect and prevent network compromise and data breaches is through early recognition and investigation of potentially suspicious network activity. If an organization ignores—or worse yet, can't even detect—activity that is out of the ordinary, then unexpected usage, unauthorized changes, and malicious attacks will go unnoticed. This may lead to network resource exhaustion, network compromise, and data breaches. On the other hand, early detection and investigation of these events can help an organization better understand how its network is being used and whether any of that usage is malicious.
SecurityCenter Continuous View (CV) collects and correlates network data from many sources, learns baseline activity, and triggers events on malicious and out-of-the-ordinary occurrences. This provides an analyst with a centralized view of current network activity and assists in detecting any suspicious activity. For example, SecurityCenter CV correlates detected intrusion activity with current network vulnerabilities to expose particularly dangerous "targeted" intrusions that are likely to succeed. The sources and destinations of network traffic are checked against IP addresses that are known to be malicious, such as those in a botnet, to reveal potentially compromised machines on the network. Network activity statistics are maintained so that spikes indicating network changes or unauthorized usage can be recognized. Crowd surges, long-term activity, and data leakage are detected. SecurityCenter CV does all of this and more.
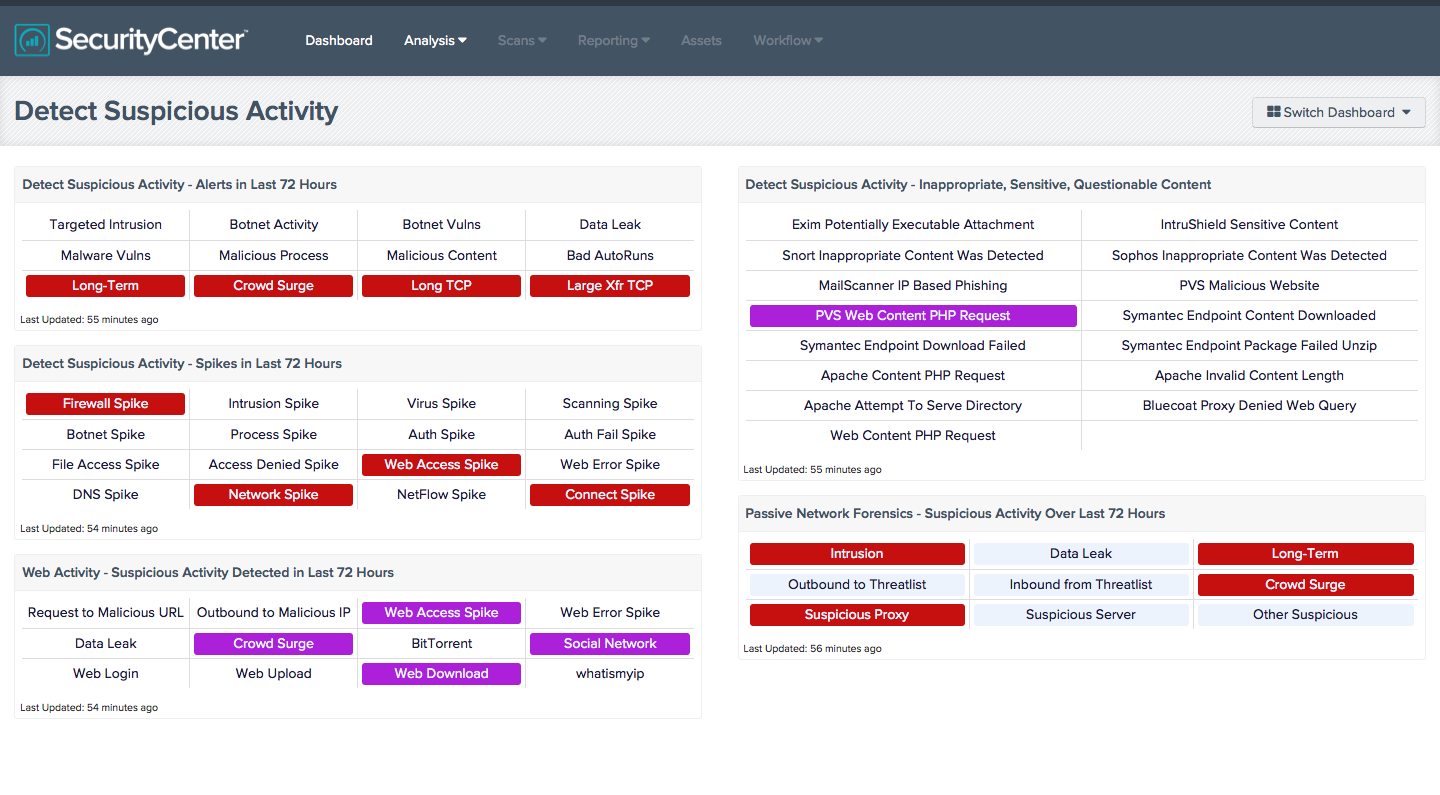
This dashboard is a collection of various components that highlight potentially unauthorized, suspicious, or malicious activity. This includes targeted intrusions, botnet interaction, activity spikes, data leakage, questionable content, and more. A highlighted indicator may not always represent nefarious activity on the network, but it does indicate activity that was detected and should be further investigated. Clicking on a highlighted indicator will bring up the analysis screen to display details on the detections and events and allow further investigation. In the analysis screen, setting the tool to IP Summary will display the systems on which the detections and events occurred. For vulnerability detections, setting the tool to Vulnerability Details will display the full details on each vulnerability, including a description, the solution to fix the vulnerability, and in some cases, links to more information. For events, setting the tool to Raw Syslog will display the raw syslog of the events, which can give more details.
The dashboard and its components are available in the SecurityCenter Feed, a comprehensive collection of dashboards, reports, assurance report cards and assets. The dashboard can be easily located in the SecurityCenter Feed under the category Threat Detection & Vulnerability Assessments.
The dashboard requirements are:
- SecurityCenter 4.8.2
- Nessus 6.3.4
- PVS 4.2.0
- LCE 4.4.1
- TenableNetworkMonitor
- TenableNetFlowMonitor
SecurityCenter Continuous View (CV) is the market-defining continuous network monitoring platform. SecurityCenter CV includes active vulnerability detection with Nessus and passive vulnerability detection with the Passive Vulnerability Scanner (PVS), as well as log correlation with the Log Correlation Engine (LCE). Using SecurityCenter CV, an organization will obtain the most comprehensive and integrated view of its network, in order to best protect its network from network compromise and data breaches.
Listed below are the included components:
- Detect Suspicious Activity - Alerts in Last 72 Hours - This matrix presents warning indicators for potentially suspicious network activity detected in the last 72 hours, such as targeted intrusions (intrusion attacks that targeted systems and ports likely to be exploited by the attacks), botnet activity, and long-term activity. Each indicator is based either on one or more Log Correlation Engine (LCE) events, or on active or passive vulnerability detections; the indicator is highlighted red if the event occurred in the last 72 hours. Any warnings should be further investigated. More information can be obtained on these events (such as details, time, and IP address) by clicking on the specific indicator and viewing the raw syslog (for events) or the detailed vulnerability list (for vulnerabilities).
- Detect Suspicious Activity - Spikes in Last 72 Hours - This matrix presents warning indicators for potentially suspicious spikes in network activity detected in the last 72 hours, such as spikes in intrusion activity, failed logins, or web error events. Each indicator is based on one or more Log Correlation Engine (LCE) statistical events; the indicator is highlighted red if the event occurred in the last 72 hours. Any warnings should be further investigated. More information can be obtained on these events (such as details, time, and IP address) by clicking on the specific indicator and viewing the raw syslog.
- Web Activity - Suspicious Activity Detected in Last 72 Hours - This matrix presents detections of potentially suspicious web activity that have occurred in the last 72 hours, including detections of interactions with malicious IP addresses, data leakage, BitTorrent activity, and other suspicious web activity. Red indicators signify activity of high severity; purple indicators signify activity that is less severe but still warrants further investigation. Clicking on a highlighted indicator will bring up the analysis screen to display details and allow further investigation. Note that this component relies on PVS detections being forwarded via syslog to the LCE.
- Detect Suspicious Activity - Inappropriate, Sensitive, Questionable Content - This component presents warning indicators for suspicious web and email content or activity. Each indicator is based on one or more LCE normalized events; if the event is detected, the indicator will change color to purple. Clicking on a highlighted indicator will bring up the analysis screen to display details and allow further investigation.
- Passive Network Forensics - Suspicious Activity Over Last 72 Hours - This matrix presents indicators of suspicious events that have occurred in the last 72 hours, including intrusions, potential data leaks, potentially unwanted long-term activity, threatlist activity (interaction with known botnets), crowd surges, suspicious proxy activity, suspicious server activity, and other suspicious host activity. Clicking on a highlighted indicator will bring up the analysis screen to display details and allow further investigation. Note that this component relies on PVS detections being forwarded via syslog to the LCE.