by Josef Weiss
April 9, 2015
Tracking errors and their causes can be difficult. Knowing which error events are anomalies can be even harder to track and understand. This report combines error events with additional related events to provide analysts with contextual understanding of the error type failures.
The Log Correlation Engine (LCE) keeps an average count (over all collected data) of error type events per hour for each IP address. This enables the LCE to 'learn' the average count of events for certain times of the day. If for a certain hour, the count of error events is significantly more or less than the average for that hour, an anomaly event is triggered. Counts of events per hour are not compared to other hours to generate anomalies; a count is compared only to the average count of events for that specific hour for days in the past. An anomaly is thus a deviation from what historically occurred at that time of day, not a deviation from what occurred earlier in the day.
This report provides summary indication of LCE error events across application, operating systems, network and security devices. Summaries of the most common error event type such as connection, authentication, DNS, and VPN errors are included. These error types are easily modified and additional error types are easily added to address specific organizational needs or requirements.
SecurityCenter Continuous View (SecurityCenter CV) allows for the most comprehensive and integrated view of network health. SecurityCenter CV provides a unique combination of detection, reporting, and pattern recognition, utilizing industry recognized algorithms and models. SecurityCenter CV utilizes the LCE to provide deep log and event inspection to continuously discover and track users, applications, and authentication events. LCE tightly integrates with SIEMs, log management tools, malware defenses, the PVS network sensor, NetFlow, BYOD, firewalls, web, and authentication systems.
The report is available in the SecurityCenter Feed, a comprehensive collection of dashboards, reports, assurance report cards and assets. The report can be easily located in the SecurityCenter Feed under the category Monitoring. The report requirements are:
- SecurityCenter 4.7
- LCE 4.4.1
This report contains the following chapters:
- Executive Summary - The chapter provides a high-level summary count of error events. The normalized events have been separated into seven different categories, each of which provides a focused view into the errors detected.
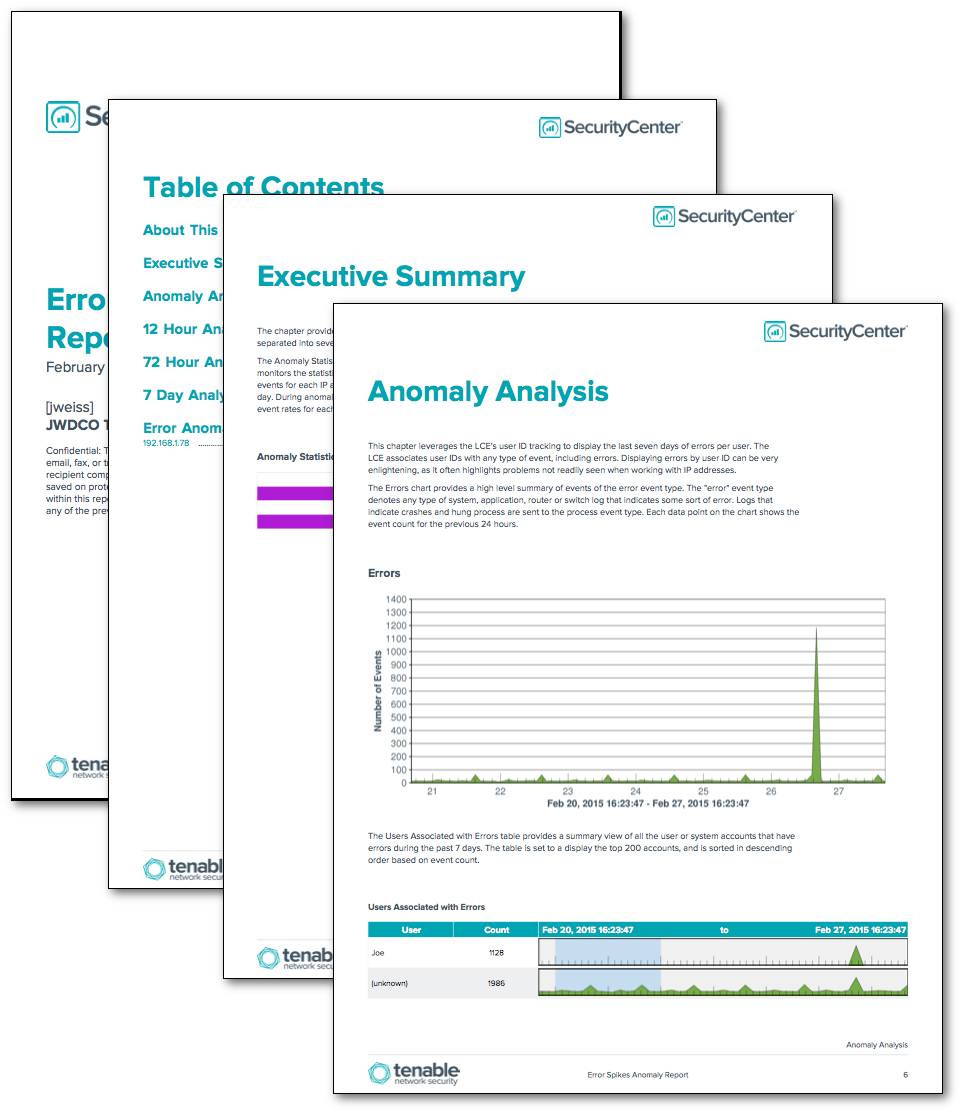
- Anomaly Analysis - This chapter leverages the LCE's user ID tracking to display the last seven days of errors per user. The LCE associates user IDs with any type of event, including errors. Displaying errors by user ID can be very enlightening, as it often highlights problems not readily seen when working with IP addresses.
- 12 Hour Analysis - This chapter provides a detailed review of error events that occurred in the last 12 hours. The events collected show analysts the most recent events and provides a recent baseline to compare to the subsequent historic chapters.
- 72 Hour Analysis - This chapter provides a detailed review of error events that occurred in the last 72 hours. The events collected show analysts the most recent events and provides a recent baseline to compare to the subsequent historic chapters.
- 7 Day Analysis - This chapter provides a detailed review of error events that occurred in the last 7 days. The events collected show analysts the most recent events and provides a recent baseline to compare to the subsequent historic chapters.
- Error Anomaly Details - This chapter provides the contextual analysis for systems with error anomalies detected. The chapter first provides a summary table listing all the systems with a error anomaly detected using the stats informational event vulnerability. Then for each system, four tables are presented: Error Summary, Intrusion Summary, NBS Summary, and Threat List.