by Josef Weiss
July 15, 2014

Security analysts often spend large amounts of time reviewing logs from systems attempting to locate the proverbial needle in a haystack. With the sheer volume of logs, Log Correlation Engine (LCE) provides several methods of focusing on the analysis process, beginning with which systems are sending logs, grouping logs by event type and also by normalizing logs. LCE supports collecting logs from several sources, with the ability to gather and process common syslog messages and data from specialized agents. The data LCE analyzes is extensive and can assist in the detection of malware, unauthorized activities, and changes to information systems. This report facilitates the initial log analysis and provides a starting point for security analysts to use while searching for compromised systems.
Organizations that choose to deploy the Log Correlation Engine Clients on workstations, servers and other network infrastructure enabled hosts, play an active role in the risk mitigation program. By implementing LCE clients on the host, LCE is able to monitor closely host based events such as running processes, file integrity events, network connections and various application events. By allowing LCE to analyze host activity, the organization is provided with content for user activities and changes to systems, which may result in vulnerabilities, malicious activity and anomalous behavior.
LCE also supports other event collection agents such as the NetFlow Monitor and the Network Monitor. These agents allow LCE to look at traffic patterns at the packet level and based on flows. LCE uses different threat detection feeds to create normalized events when suspicious activities are discovered. LCE also supports special correlated events that can aid in the timeline analysis. The LCE Web Query Client uses web-based APIs to extract cloud-based logs or other specialized events collection (such as RDEE and Splunk). When gathering logs from all aspects of the network, SecurityCenter Continuous View (CV) combines the events in event-based vulnerabilities, providing host detection and a deeper view into the security posture of an organization.
LCE supports over 35 different event types and over 10,000 normalized events, facilitating a very complete and robust threat detection system. When fully integrating SecurityCenter CV with the Nessus Network Manager (NNM), formally known as the Passive Vulnerability Scanner (PVS) and Nessus, the organization can obtain a comprehensive view of the threat vectors to which their systems are exposed. When LCE or NNM detects malicious activity or when new systems come online, alerts can be configured to send email and launch scans. With the ability to collect information on running processes and detecting when a “Never Before Seen” event occurs, SecurityCenter CV can provide valuable information at the time the system is compromised.
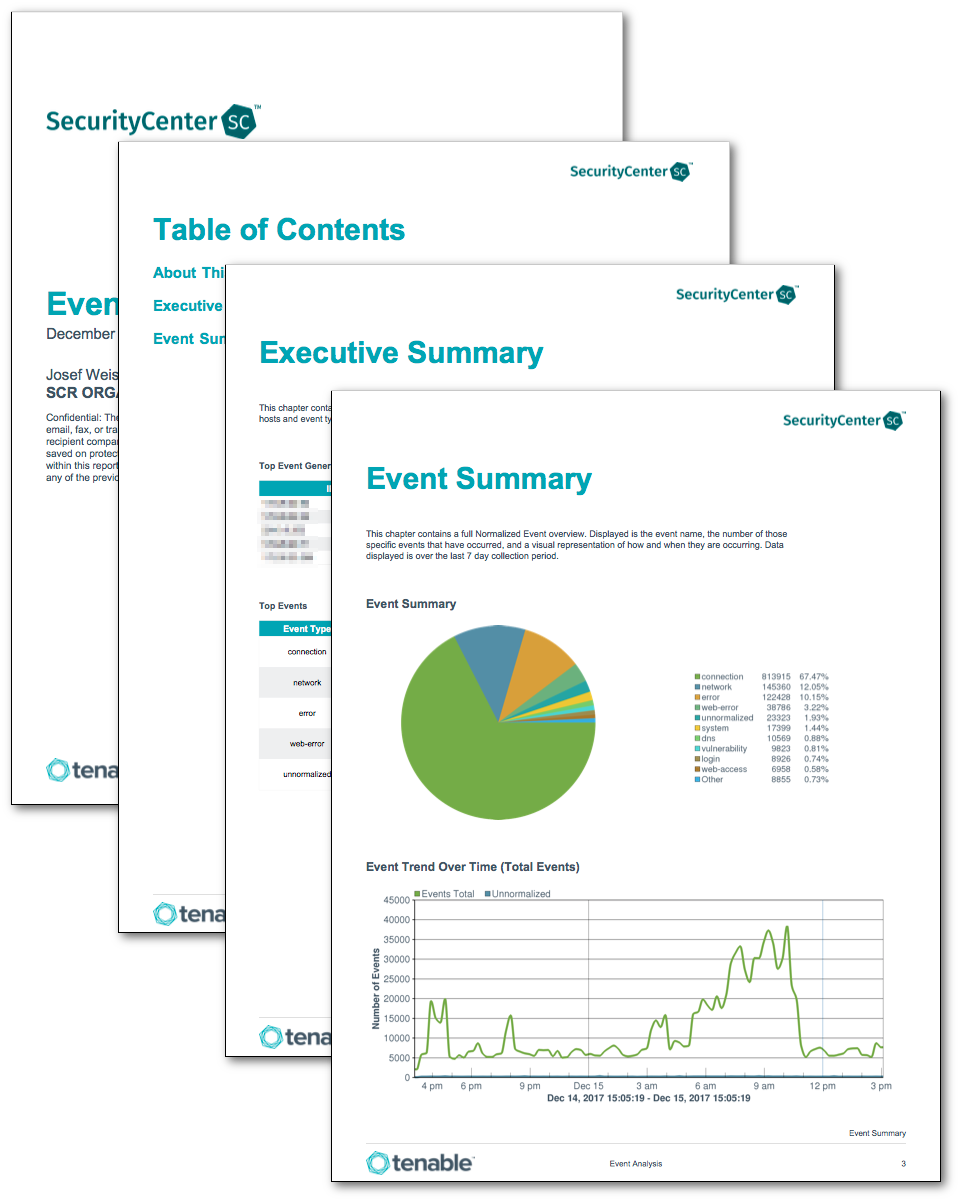
This report contains information that provides an overview of collected events. This information provides the analyst with many different methods to quickly locate actionable context in your data. The displayed events can alert analyst to abnormal activity, such as increased event types, connections, or changes in client behavior, from any device that has logs aggregated by Log Correlation Engine. This is important, as near-instant visibility can assist in pinpointing threats rapidly, and is the counterpart of the Event Analysis Dashboard found here:
Event Analysis DashboardThe report is available in the SecurityCenter Feed, a comprehensive collection of dashboards, reports, assurance report cards and assets. The report can be easily located in the SecurityCenter Feed under the category Monitoring. The report requirements are:
- SecurityCenter 4.8.2
- LCE 5.0.2
SecurityCenter Continuous View (SecurityCenter CV) is the market-defining continuous network monitoring solution. SecurityCenter CV includes active vulnerability detection with Nessus and passive vulnerability detection with NNM, as well as log correlation with the LCE. Using SecurityCenter CV, an organization obtains the most comprehensive and integrated view of the network and the cloud services being used.
Included chapters are:
Executive Summary – This chapter contains several components that provide a representation of the amount of data flowing for each of the top 5 type events present within the last 24 hours.
Event Summary – This chapter contains a full Normalized Event overview. Displayed is the event name, the number of those specific events that have occurred and a visual representation of how and when they are occurring. Data displayed is over the last seven day collection period.