by Josef Weiss
September 11, 2014
This report supports the Tenable document titled ‘Predicting Attack Paths’, and the dashboard collection of the same name. A series of chapters are provided to assist the analyst in identifying systems on the network that can be exploited in a variety of methods. Methods include both passive and active reporting of exploits, trust relationships, and reporting of internet browsing hosts. This data can be leveraged to rapidly identify vulnerabilities that are subject to attack and exploitation.
Tenable provides continuous network monitoring to identify vulnerabilities, reduce risk, and ensure compliance. SecurityCenter Continuous View allows for the most comprehensive and integrated view of network health. Nessus is the global standard in detecting and assessing network data.
Tenable’s Log Correlation Engine (LCE) provides deep packet inspection to continuously discover and track users, applications, cloud infrastructure, trust relationships, and vulnerabilities.
Tenable’s Passive Vulnerability Scanner (PVS) provides deep packet inspection to continuously discover and track users, applications, cloud infrastructure, trust relationships, and vulnerabilities.
The following chapters are included in the report:
- Trust Relationships - This chapter contains three components to assist in reporting trust relationships. The first component graphs data on internal client trusted client and server connections over a 90-day period. Data is presented via an area chart for Client/Server relationships. The table Client/Server Relationships graphs data on internal client trusted client and server connections over a 90-day period. The table Most Trusted Servers, leverages plugin #15 (Internet server trusted connection), to present data on clients which have connected to a given server, and what port the connection has taken place on.
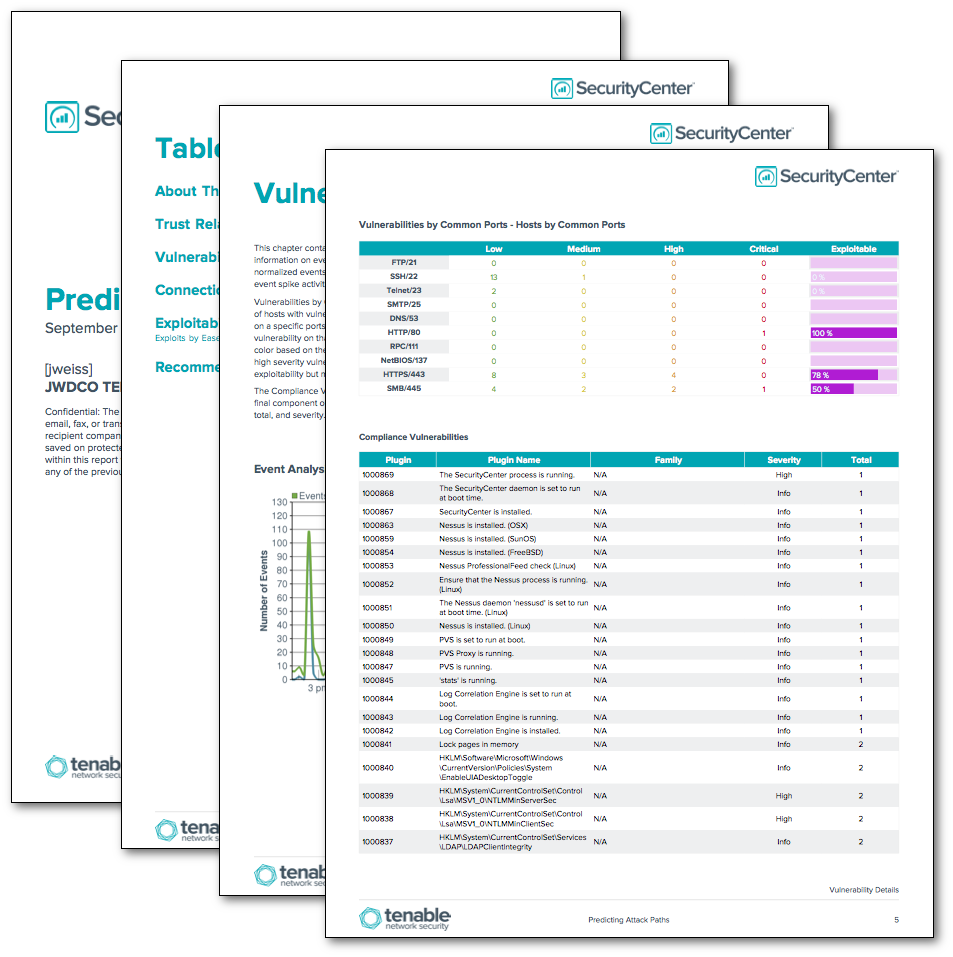
- Vulnerability Details - This chapter contains four components to assist in vulnerability reporting. The line chart component displays information on event trends over time. Displayed is a line chart comparison over the last 24 hours of total normalized events versus unnormalized events. This provides the analyst with a quick overview of any current event spike activity. Vulnerabilities by Common Ports – Hosts by Common Ports, contains six columns that enumerate the number of hosts with vulnerabilities on a specific port. The columns provide a count of vulnerable hosts based on a specific ports and severity level. The last column provides a percentage of hosts with an exploitable vulnerability on that port. The colors used in this matrix have a transparent background and change the color based on the severity level. The color green represents low severities, yellow is for medium severity, high severity vulnerabilities are orange, and critical severities are red. The last column in purple shows exploitability but makes no reference to severity level. The Compliance Vulnerabilities table presents a vulnerability summary sorted by plugin type Compliance. The final component of this chapter is a summary of the Most Prevalent Vulnerabilities. Vulnerabilities sorted by total, and severity.
- Connections Details - The Connection Details chapter contains four components that provide a summary of connection details. The first component, Hosts That Accept External Connections utilizes data from plugin #14 named “Accepts external connections”. This includes UDP and TCP services, to present data via IP Summary tool on host IP address, NetBIOS, MAC address, and DNS of hosts that are passively found to accept external connections. Internet Browsing Hosts utilizes plugin #16, which specifically tracks which systems connect to the Internet and on which ports. To produce lists of internal systems that connect to the Internet, a dynamic or static asset list can be created by listing all of the IP addresses that matched PVS plugin #16. To produce a more detailed list of internal systems that connected to the Internet on specific ports, consider adding port filters for common ports such as 21, 22, 25, 80, 443, 465, and so on. Netstat Analysis utilizes Nessus credentialed scans that report all of the active network connections for a given host or server. SecurityCenter can use the output from these scans to help categorize hosts as clients, servers, Internet browsers, or systems that offer active connections to the Internet. This component utilizes plugin 58651 (Netstat Active Connections) and the IP Summary Tool to display netstat information on scanned hosts. Drilling into the data for each system presents the analyst with a list of active Internet connections for each host. The final component uses information from plugin #14 “Accepts external connections”, and the Port Summary tool to present a table that is sorted by the most commonly observed active ports. This allows the analyst to determine which ports are open externally.
- Exploitability Details - This chapter contains three components, and a section on Ease of Exploit to assist in exploitability reporting. The first component filters on five different plugin types and presents data based on the number of vulnerabilities per plugin type, the percentage of those vulnerabilities that are known to be exploitable. Regex is used to further determine what products can take advantage of the exploits. The counts presented in the additional columns are the number of vulnerabilities exploitable by Metasploit, Core Technologies, Canvas, or Malware. The second component reports the top exploitable hosts. The third component utilizes a function within PVS, where PVS tags any vulnerability it finds with the ‘External Access :’ string. This component uses this string as a filter, in conjunction with plugin id 14, exploits available set to true, and ports greater than or equal 1, to identify internet facing devices that have exploitable vulnerabilities.
- Exploitability Details - Section: Exploits by Ease of Exploit - This section contains a Class C summary component with filters for the vulnerability text AC: as well as the type of Active Vulnerabilities and exploit set to yes. Exploit data is presented by three tables that provide details on the exploits that have been identified in the environment, as well as the ease at which those exploits can be exploited, using the AC:H, AC:M and AC:L vulnerability text filter.
- Recommended Remediation - This chapter summarizes remediation actions across a series of hosts. Rather than just counting the number of vulnerabilities, applications are listed which need to be upgraded, or patched. The remediation table also highlights systems missing one or more Microsoft patches. This not only is much easier for an IT administrator to consume, but also provides a measure of how much 'work' is required to secure a network, as well as the amount of risk reduced when certain patch efforts are taken.