More Visibility into Metrics: Tenable.io Gets New Dashboards

Tenable.io users have been asking for new dashboards to make implementing Cyber Exposure easier, and the Tenable dashboard and reporting teams have delivered. We’ve added five new dashboards to Tenable.io, allowing you to gain more visibility into key topics like vulnerability metrics, risk mitigations and exploit reporting.
These five new dashboards are popular dashboards available in SecurityCenter, now upgraded for the Cyber Exposure Lifecycle. Let’s take a peek:
#1. Executive Summary dashboard
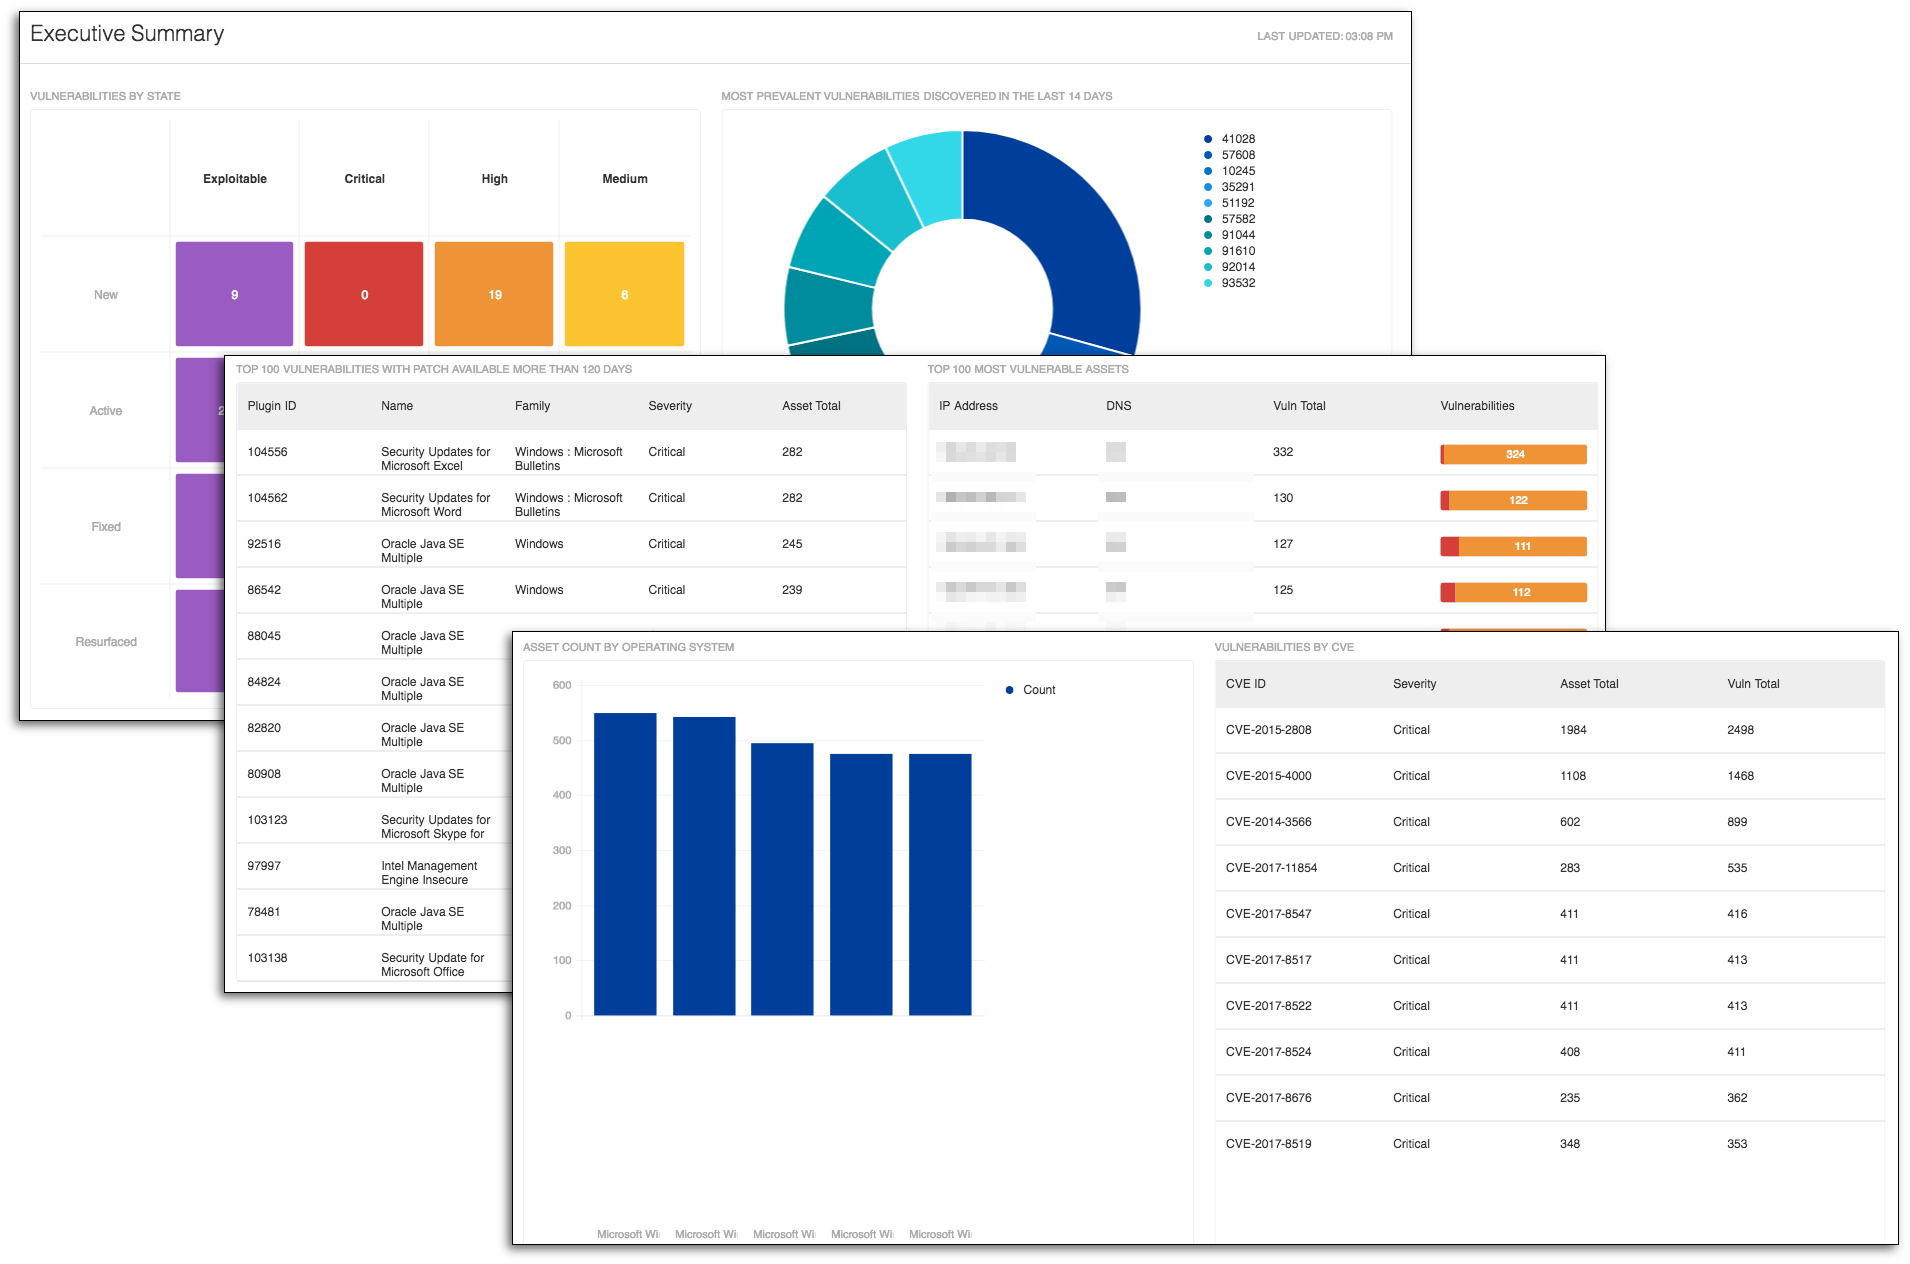
The Executive Summary dashboard takes into account several metrics available in Tenable.io and allows you to narrow the search down to a few key metrics (e.g., severity, Common Vulnerabilities and Exposures [CVE] identifier and vulnerability state). I find this dashboard useful when talking to executives about their Cyber Exposure initiative and measuring their organization's cyber risk.
Executives can easily review and analyze security metrics, taking away a better understanding of the maturity of the Cyber Exposure Lifecycle. As the security director introduces the Cyber Exposure discipline to the organization, they can use this dashboard to measure the modern attack surface to accurately understand and reduce cyber risk. The discipline helps executives to better direct and focus mitigation efforts and report using industry-accepted metrics. Tenable.io facilitates the implementation of the five Cyber Exposure Lifecycle steps and provides a common place for analyzing vulnerability data.
#2. Exploitable Framework Analysis dashboard
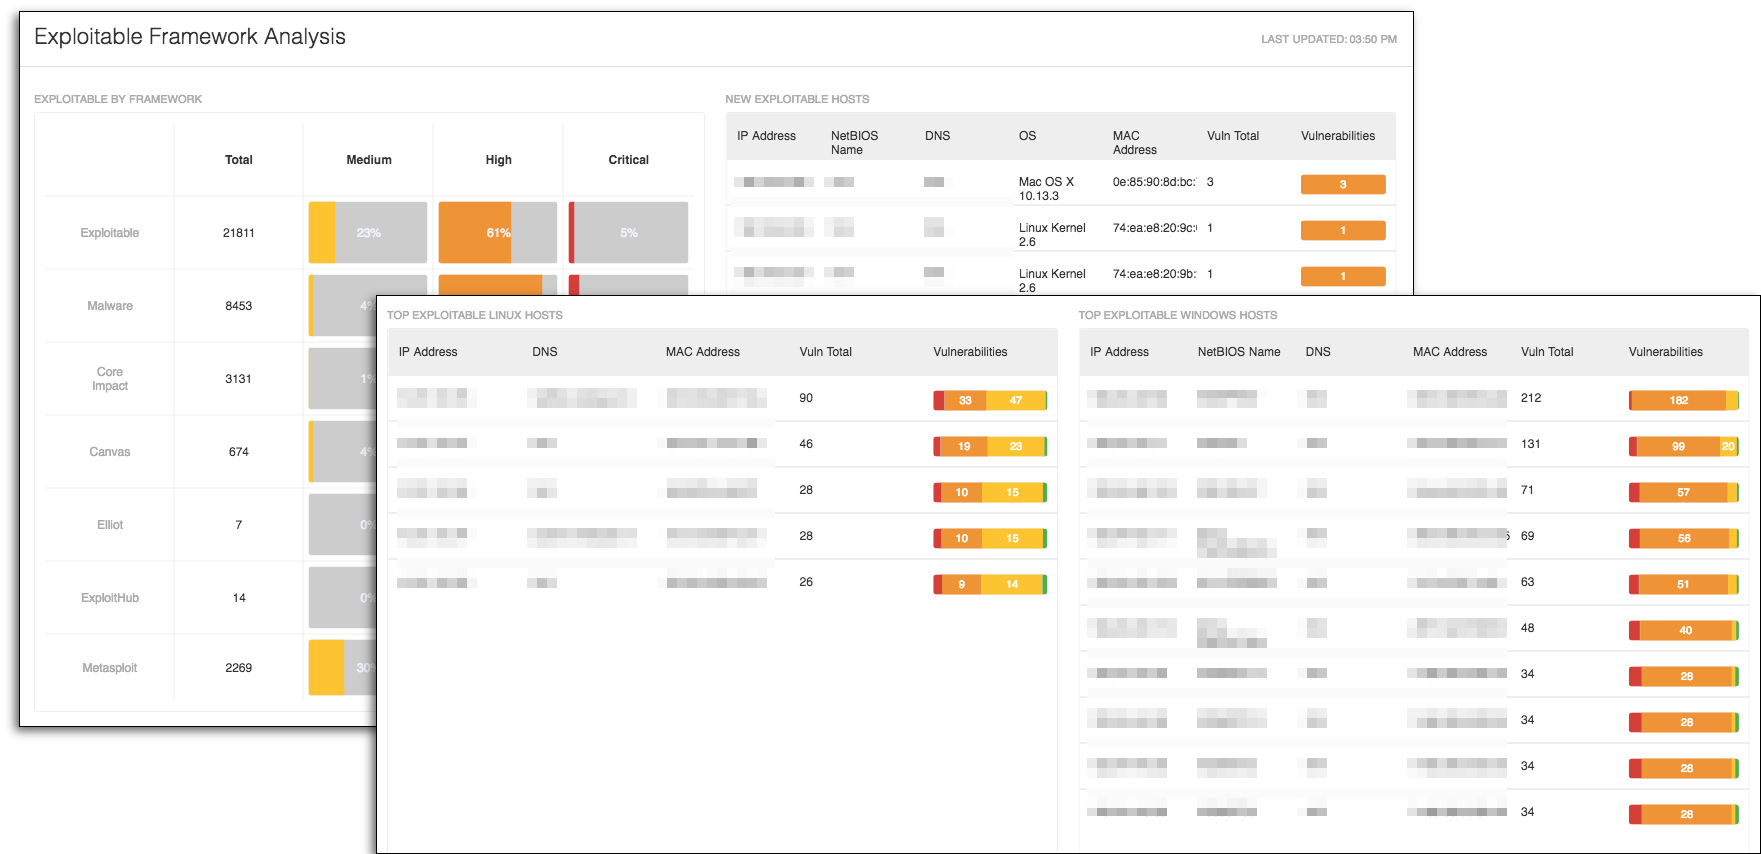
When discussing Cyber Exposure with security teams, one key metric is exploitability and how easily can a vulnerability be exploited. The Exploitable Framework Analysis dashboard provides you with information needed to predict which assets are most likely to be compromised when attacked.
To further analyze the network, security teams often conduct internal penetration testing. The National Institute of Standards and Technology (NIST) 800-53 control CA-8 Penetration Testing defines penetration testing as “a specialized type of assessment conducted on information systems or individual system components to identify vulnerabilities that could be exploited by adversaries.” To aid in this specialized assessment, security teams use exploitation frameworks such as Core Impact, Canvas and others. This dashboard provides you with a centralized view of which frameworks are most commonly found on vulnerabilities in your network.
#3. Measure Vulnerability Management dashboard
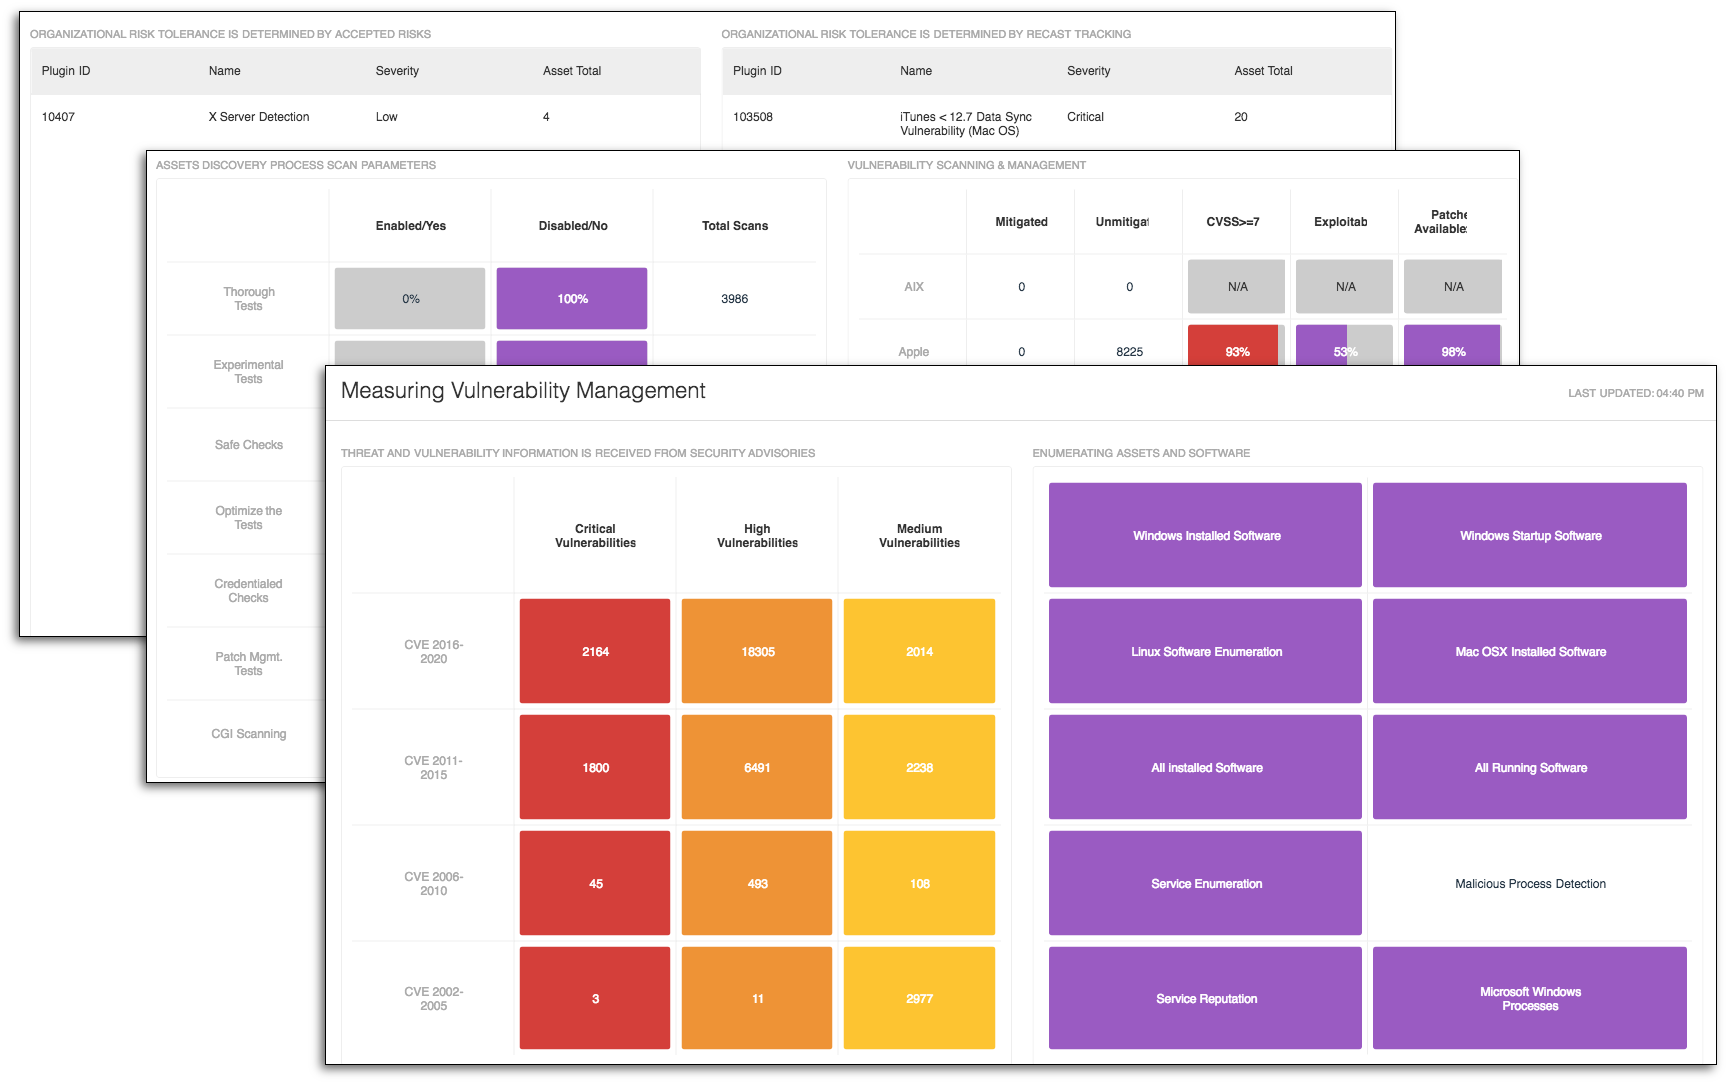
When creating the Measure Vulnerability Management dashboard, our goal was to provide a very complete view into the Cyber Exposure discipline progress. We also designed the dashboard to assist the IT security team by organizing the vulnerability management data.
The dashboard follows guidelines outlined in many of the emerging security frameworks. Beginning with a Common Vulnerabilities and Exposures (CVE) matrix, you can easily zero in on vulnerabilities identified by security advisories. Next, a matrix provides you with several saved searches that help identify hidden vulnerabilities or can assist in looking for compromised systems. The dashboard shows enumerated software, running process and other sources of system resource usage. As part of the server management team or security team, you’ll be able to benefit from these widgets.
To help the vulnerability management team, there’s useful data about how scans are executed and which operating systems have the most vulnerabilities. When analyzing vulnerabilities by operating system, I often recommend using the plugin family, which allows you to visualize vulnerabilities that often have common support teams and patching cycles. This vulnerability data is then further grouped into columns of escalation grouping, consisting of CVSS, exploitability and if there’s a patch available or not. Lastly, if you’ve accepted or recast vulnerabilities, this dashboard provides information to help you monitor risk acceptance.
#4. Mitigation Summary dashboard
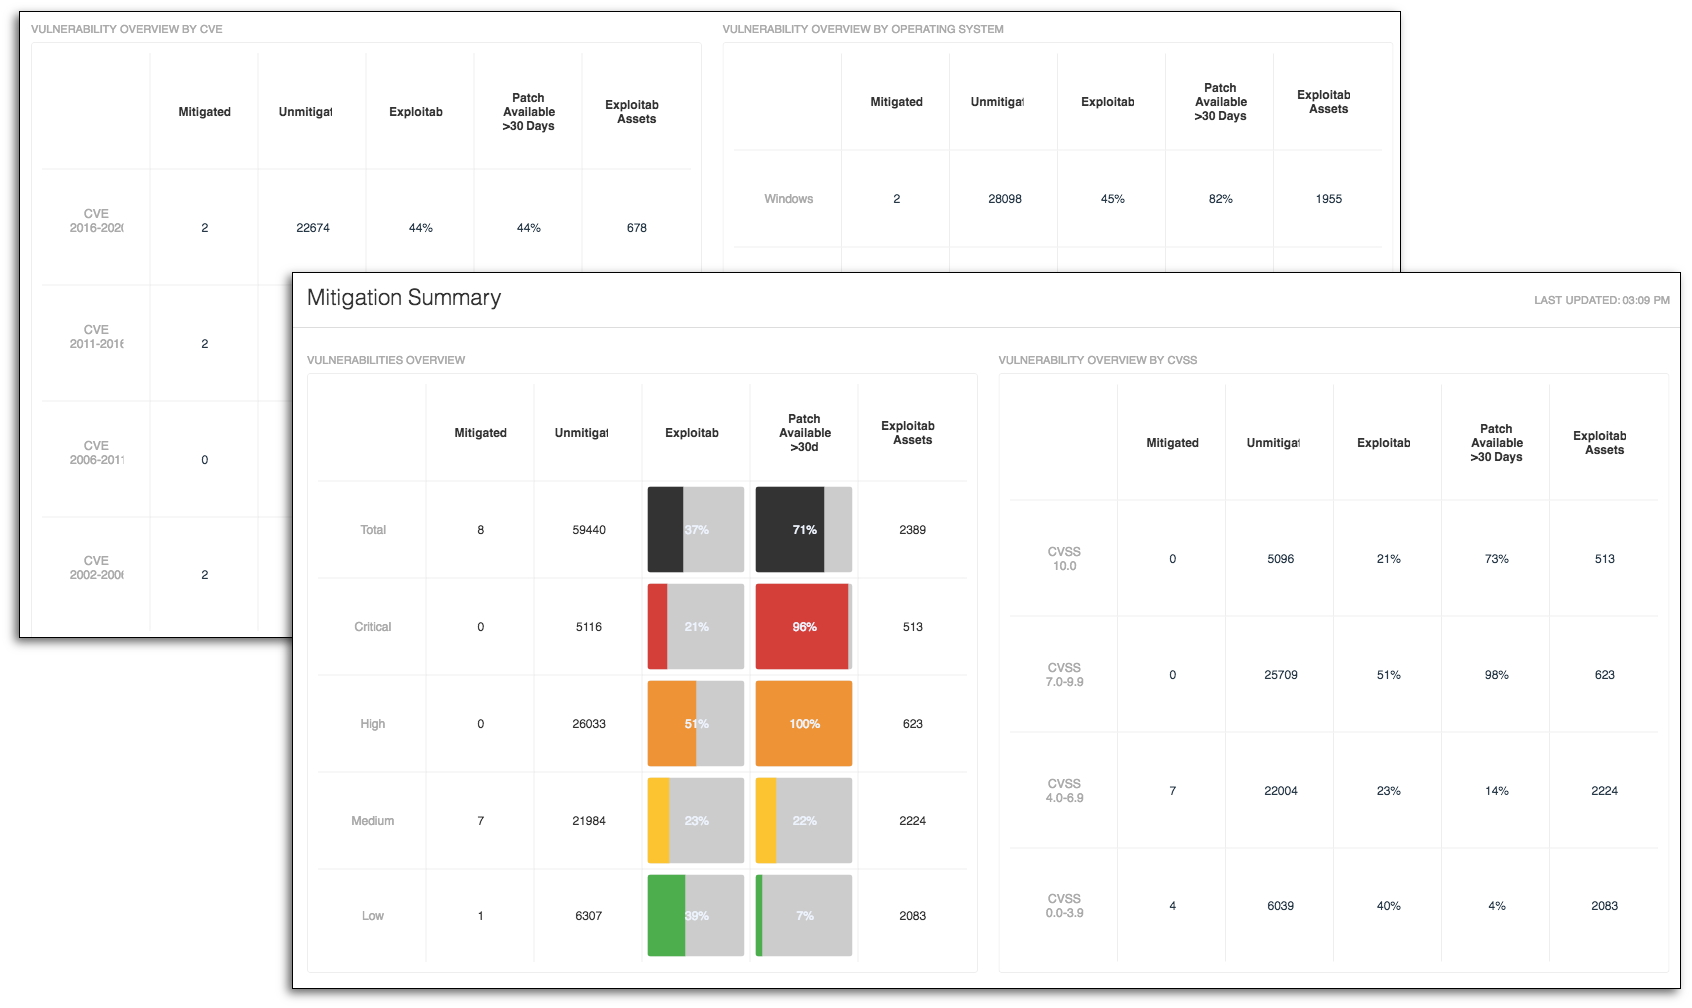
The Mitigation Summary dashboard helps illustrate Cyber Exposure progress to management and show the work remaining. Each widget in this dashboard has five columns: The first uses the vulnerability state tag to provide a list of vulnerabilities that have been fixed. The remaining columns provide insight into the remaining work. Each matrix focuses on a different aspect of Cyber Exposure.
Using the CVSS base score helps risk managers do a quantitative analysis by rating each vulnerability with computational score. Another metric I find useful for discussing Cyber Exposure with auditors is CVE. This dashboard provides an easy way to see how many CVEs have been mitigated and how many remain outstanding. Finally, grouping vulnerabilities by operating system is helpful when looking for patch management and change control operations. This information allows you to monitor the process of patch deployment as numbers move from the right unmitigated column to the mitigated column.
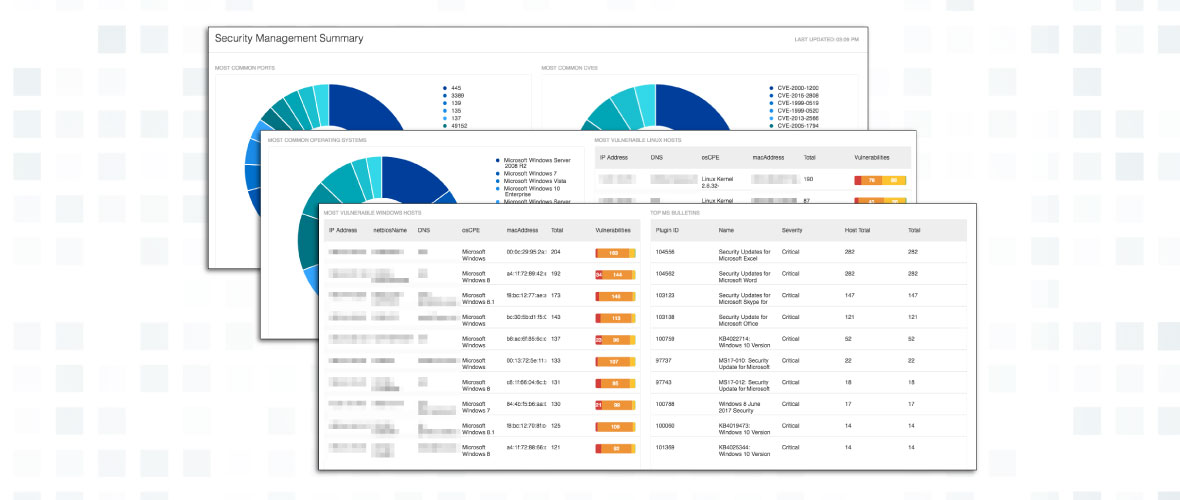
#5. Security Management Summary dashboard
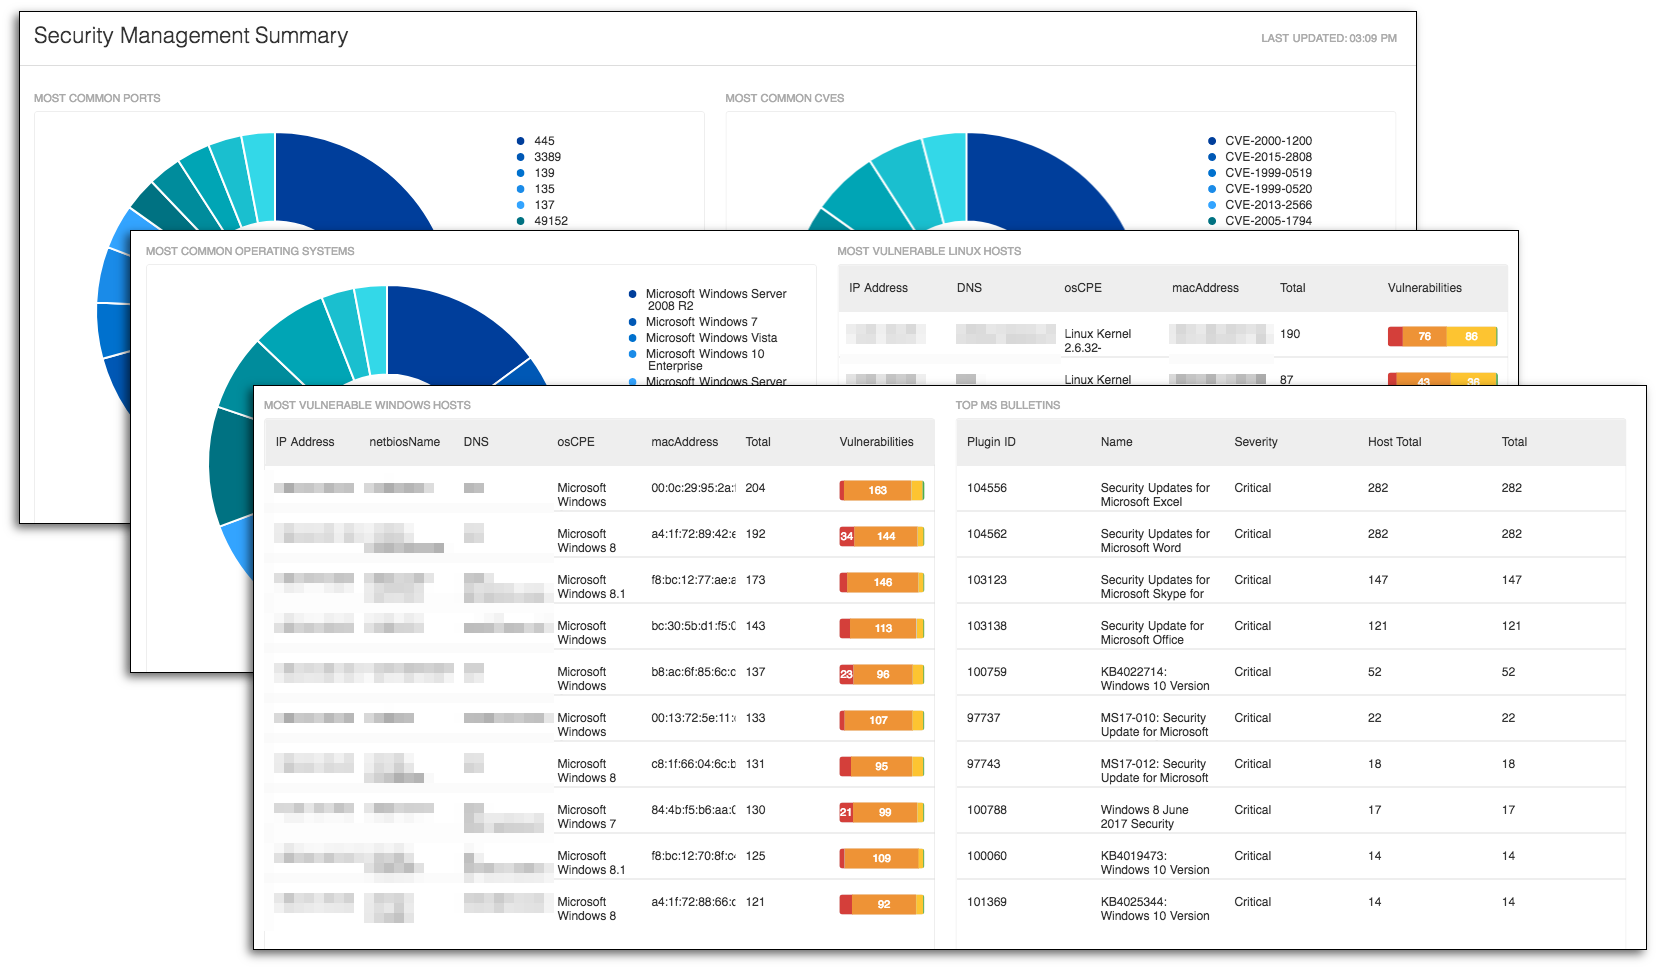
The Security Management Summary dashboard is used primarily to identify the vulnerabilities and cyber risk that need to be mitigated. When using this dashboard, I can easily view the Transmission Control Protocol (TCP) ports found on the network. Using the native drill-down features, I can easily identify all the vulnerabilities with each port.
The dashboard also shows me the most prevalent vulnerabilities by CVE. The CVEs in this dashboard can easily be prioritized and mitigated. I use this dashboard to identify the common operating systems and the Linux and Windows hosts most at risk. In a nutshell, this dashboard helps you prioritize risk mitigation efforts.
Wrapping up
Tenable.io contains a wealth of data to help managers, security teams and executives understand and minimize the cyber risk within your organization. These dashboards provide a more centralized view of several useful metrics, such as mitigated vulnerabilities, CVSS Scores, CVE and many others. By using this technology, your company can be successful in identifying and mitigating cyber risk.
Learn more
Learn more
Related articles


- Tenable Vulnerability Management
Tenable One
Request a demo
The world’s leading AI-powered exposure management platform.
Thank You
Thank you for your interest in Tenable One.
A representative will be in touch soon.
Form ID: 7469
Form Name: one-eval
Form Class: c-form form-panel__global-form c-form--mkto js-mkto-no-css js-form-hanging-label c-form--hide-comments
Form Wrapper ID: one-eval-form-wrapper
Confirmation Class: one-eval-confirmform-modal
Simulate Success