What Is VPR and How Is It Different from CVSS?

This blog series will provide an in-depth discussion of vulnerability priority rating (VPR) from a number of different perspectives. Part one will focus on the distinguishing characteristics of VPR that make it a more suitable tool for prioritizing remediation efforts than the Common Vulnerability Scoring System (CVSS).
What is VPR?
Vulnerability priority rating (VPR), the output of Tenable Predictive Prioritization, helps organizations improve their remediation efficiency and effectiveness by rating vulnerabilities based on severity level – Critical, High, Medium and Low – determined by two components: technical impact and threat.
Technical impact measures the impact on confidentiality, integrity and availability following exploitation of a vulnerability. It is equivalent to the CVSSv3 impact subscore. The threat component reflects both recent and potential future threat activity against a vulnerability. Some examples of threat sources that influence VPR are public proof-of-concept (PoC) research, reports of exploitation on social media, emergence of exploit code in exploit kits and frameworks, references to exploitation on the dark web and hacker forums and detection of malware hashes in the wild. Such threat intelligence is key in prioritizing those vulnerabilities that pose the most risk to an organization.
VPR is designed for vulnerability prioritization
The CVSS framework has long been criticized for its inability to prioritize vulnerability remediation effectively and efficiently. This is mainly due to the fact it was designed to measure the technical severity of vulnerabilities rather than the risk they pose. A report published by Carnegie Mellon University [CMU2019] points out:
The Common Vulnerability Scoring System (CVSS) is widely misused for vulnerability prioritization and risk assessment, despite being designed to measure technical severity.
One of the often criticized issues, when it is used for vulnerability remediation, is the large proportion of High and Critical vulnerabilities in the CVSS rating. At the time this blog post was written, there were more than 16,000 vulnerabilities rated as 9.0 or higher (per CVSSv2) – accounting for 13% of all vulnerabilities. CVSSv3, the latest major version of CVSS, does not improve on this issue. Over 60,000 vulnerabilities have been rated by CVSSv3 since its release in June 2015. Around 9,400 CVSSv3 vulnerabilities were rated as 9.0 or higher – accounting for 16% of all CVSSv3 vulnerabilities. When a large percentage of vulnerabilities are deemed critical, prioritization is cumbersome.
Figure 1. Compare CVSSv3 and VPR vulnerability distributions by criticality ratings
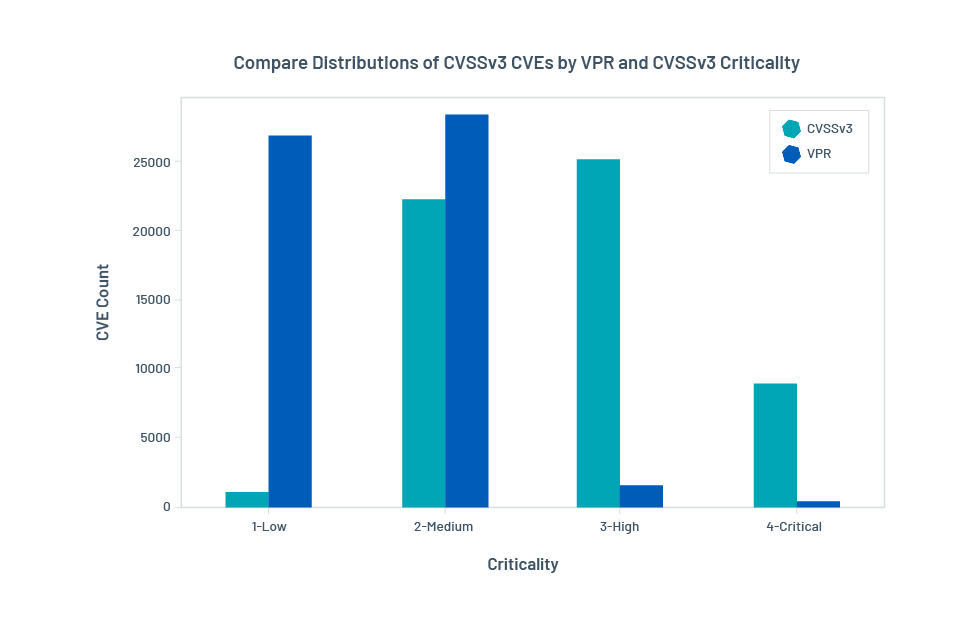
VPR is designed to avoid this type of issue by incorporating threat information into its formula. The chart above compares the vulnerability distribution of VPR and CVSSv3. Due to the dynamic nature of threats, the number of VPR Criticals changes slightly every day. On an average day, VPR rates around 700 vulnerabilities as Critical, and fewer than 5,000 as High. These numbers account for less than 1% and 4%, respectively, of all vulnerabilities. With fewer Critical vulnerabilities to focus on, security teams can design vulnerability remediation plans more efficiently.
A natural question to ask at this stage is that of efficacy: How many risky vulnerabilities can be captured by VPR? The remainder of this blog post will compare the efficacy of VPR and CVSSv3 in identifying risky vulnerabilities. But first, we will examine how VPR is generated.
VPR: Under the hood
At the heart of VPR are machine learning models working together to forecast threats. Specifically, the threat forecast seeks to answer the question: What is the appropriate level of near-term threat for a vulnerability based on the latest available data? To train VPR models to answer this question, it is fed with historical data sourced from various feeds:
- Threat intelligence feeds provide information on exploits and attacks relating to vulnerabilities, such as observations of Indicators of Compromise (IoC), references to exploitation on the dark web, reports of exploitation on social media or code repositories and so on. They provide VPR with information about which vulnerabilities are potentially linked to exploitation and which have been under active attack.
- Exploit repositories/kits provide information on exploit code maturity. Different levels of maturity (from PoC to weaponized) contribute differently to the threat.
- Vulnerability repositories and security advisories provide intrinsic vulnerability characteristics that may also be correlated with the threat.
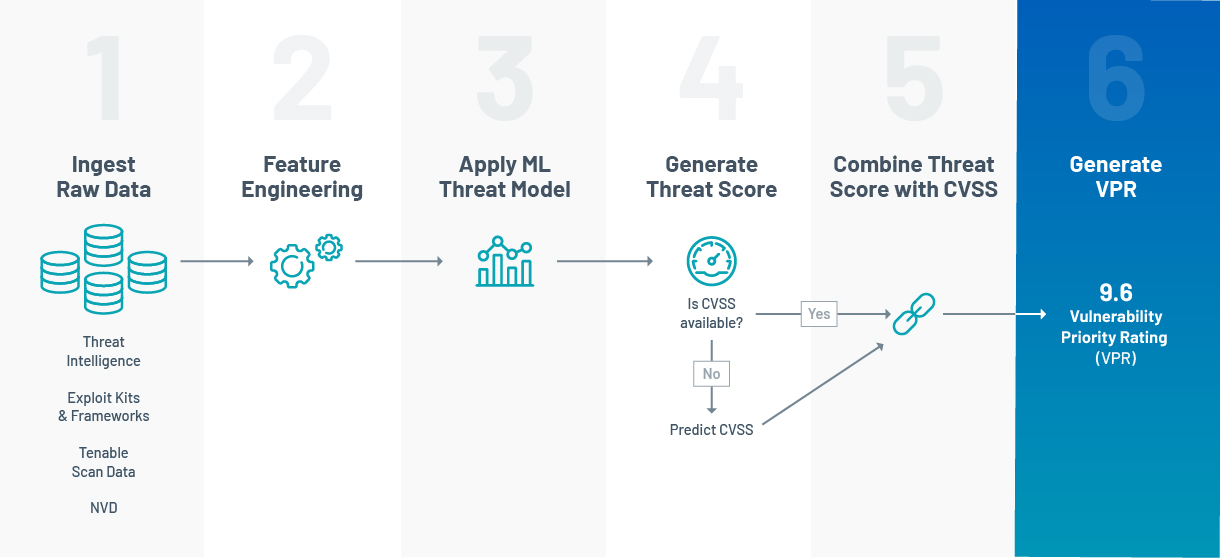
Collectively, this raw data is fed to the VPR pipeline on a daily basis. The VPR score (9.6 in the example below) is generated by combining the predicted threat and the impact (taken from the CVSSv3 impact score) for each vulnerability. Figure 2 illustrates this process.
Figure 2. VPR Pipeline
Comparing VPR with CVSS for vulnerability remediation
Comparative analyses highlight that a remediation strategy based on VPR can have higher efficacy than a CVSS-based approach.
VPR prioritizes vulnerabilities with emerging exploitation
Taking a proactive stance against emerging threats can help security teams attain a time buffer for hardening their attack surface. One example of proactive defense is to frequently scan the network and patch every vulnerability classified as CVSS Critical in the remediation window. This approach can lead to high efficacy in network hardening, but is usually difficult to execute due to the sheer volume of vulnerabilities falling into this category.
VPR is designed to prioritize vulnerabilities with a higher likelihood of being targeted by threat actors in the near term while filtering out those deemed to be less risky. This is the predictive nature of VPR. At this point, one might be curious about how predictions are made. There is no magic here! VPR’s prediction is based on a simple rule: The evolution of the threat for a vulnerability in the wild will typically follow the same pattern as similar vulnerabilities have followed in the past.
In the following tables, we show that remediation strategies designed to follow VPR can achieve the same level of efficacy as fixing all CVSS Criticals with much higher efficiency. Here, we use the ability to identify vulnerabilities with IoC in the next 28 days to benchmark VPR against CVSSv3. IoCs are artifacts that are often considered strong evidence of exploitation. They include malware hashes, IP addresses, URLs and so on. We obtain IoCs from commercial data providers such as ReversingLabs and VirusTotal.
Table 1. The number of vulnerabilities with IoC spotted in the wild in the next 28 days for VPR (left) and CVSSv3 (right)
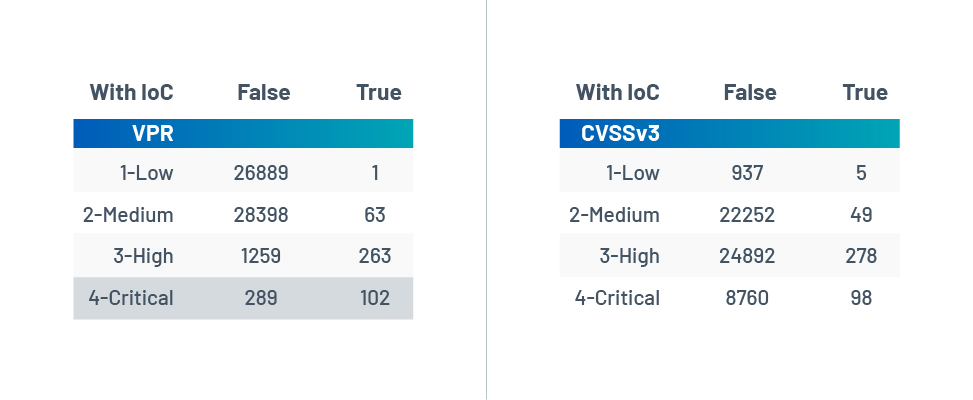
False - No IoC spotted in the 28 days after VPR is calculated
True - IoC spotted in the 28 days after VPR is calculated
The above tables compare the performance of VPR (left) with CVSSv3 (right) for predicting vulnerabilities with threat in the next 28 days. The VPR scores used in this example are taken from January 2020 and the vulnerabilities’ IoCs are collected from the 28-day period after VPR was generated. VPR High and Critical have similar coverage as CVSSv3 for identifying vulnerabilities with IoC. In other words, both strategies capture a similar number of vulnerabilities with actual IoCs in the next four weeks: 365 out of 428 for VPR High and Critical, 376 for CVSS High and Critical.
However, VPR is far more efficient than CVSSv3 at predicting vulnerabilities with IoCs in the next 28 days. Comparing the two, there are 26% VPR Critical and 17% VPR High versus just 1% for both CVSSv3 Critical and High. Remediating the top 1,500 VPR scores is as efficacious as remediating the top 33,000 CVSSv3 scores – approximately 22 times more efficient.
VPR prioritizes vulnerabilities with known exploit code
Having highly mature exploit code increases the likelihood that cybercriminals will use the vulnerability in a cyberattack. Hence, it is important for VPR to prioritize vulnerabilities with publically available exploit code. Note that our classification of exploit code maturity used in this analysis follows the convention of CVSS. In summary, high maturity means functional, autonomous exploit code exists. Functional means exploit code is weaponized and PoC means the exploit code works, in theory. More details can be found on CVSSv3 specs [CVSSv3]. We source exploit code from multiple repositories and exploit kits, such as Metasploit, Core Impact, Exploit DB, D2 Elliot, Packet Storm, just to name a few.
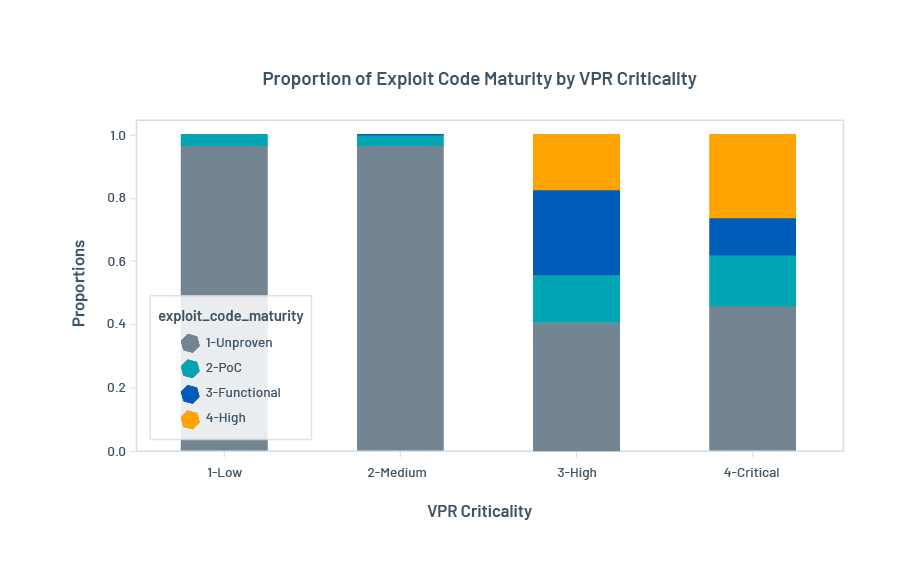
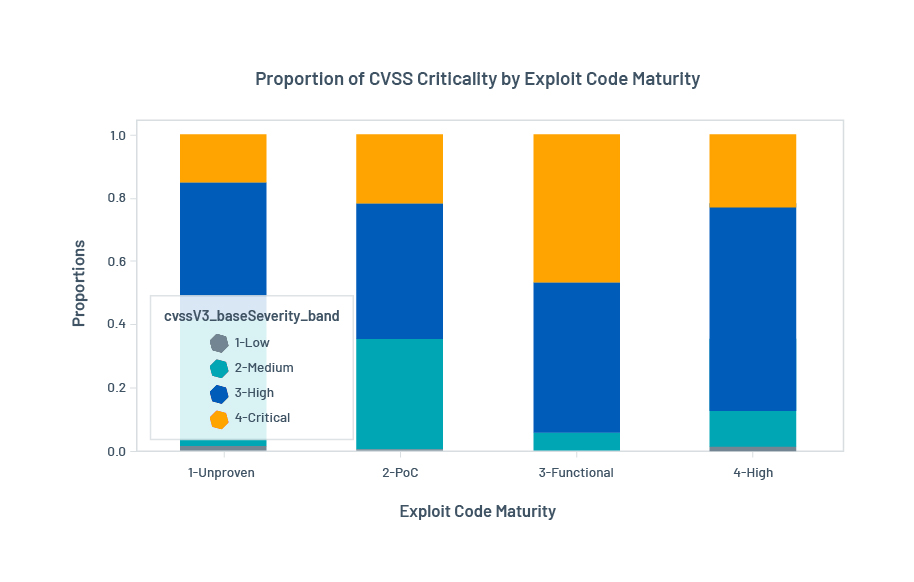
Figure 3 compares the proportion of vulnerabilities with known exploit code available for VPR and CVSSv3. More than half of VPR Critical vulnerabilities (54%) have public exploit code (i.e., high, functional and PoC) versus 15% for CVSS Critical vulnerabilities. This shows that prioritizing vulnerabilities using VPR will reduce the risk posed by vulnerabilities with exploit code on the web.
Figure 3. Proportion of vulnerabilities in each criticality band broken out by exploit code maturity for VPR (top) and CVSSv3 (bottom)
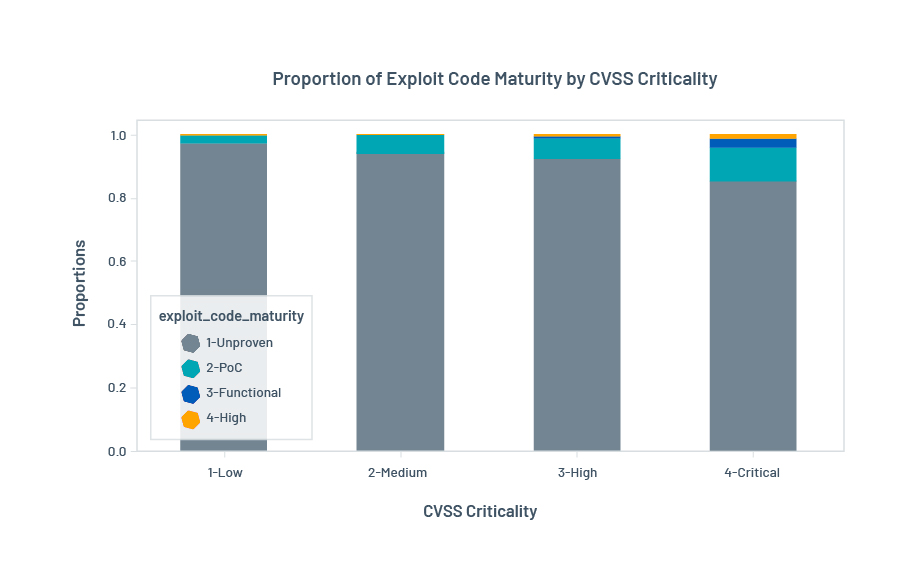
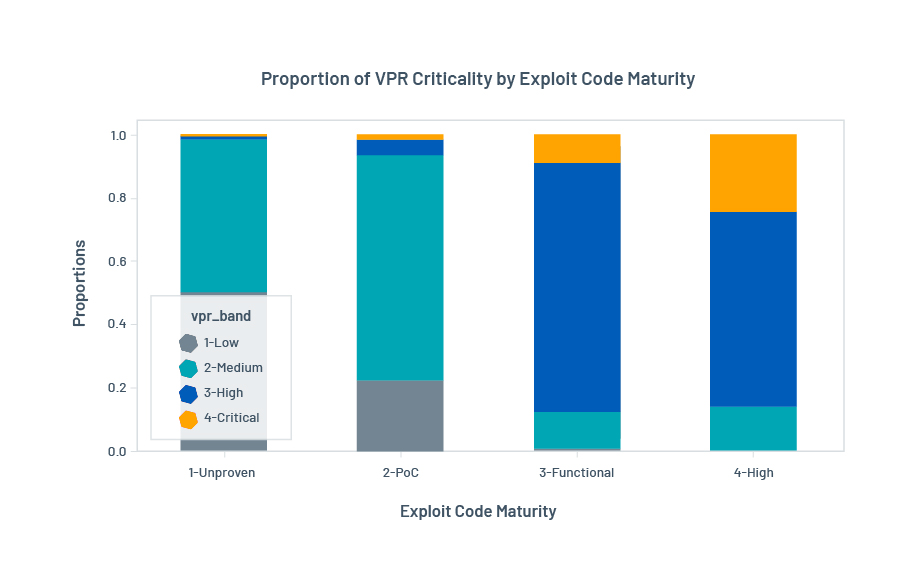
The next question to ask is: What proportion of vulnerabilities with high and functional exploit code is captured by VPR? In other words, what is the coverage of VPR for vulnerabilities with highly mature exploit code? Figure 4 compares the proportion of VPR and CVSS criticalities for all levels of exploit code maturity:
- Vulnerabilities with higher exploit code maturity (high and functional) are mostly captured by Critical and High vulnerabilities in VPR. This is similar to CVSS. But, considering the large number of CVEs being rated as Critical and High in CVSSv3, VPR is more effective at prioritizing vulnerabilities with known exploit code.
- The distribution of VPR criticality is very different for vulnerabilities with higher maturity exploit code (i.e., high and functional) than lower maturity (i.e., PoC and unproven). Most vulnerabilities with PoC exploit code are rated as Medium VPR. And, VPR scores vulnerabilities with unproven exploit code as Low. On the other hand, CVSSv3 has a more even distribution across all exploit code maturity levels. This shows from a different angle that VPR High and Critical are more strongly correlated to high/functional exploit code maturity than CVSS High and Critical.
Figure 4. Proportion of vulnerabilities in each exploit code maturity band broken out by vulnerability criticality levels: VPR (top) and CVSSv3 (bottom)
VPR prioritizes vulnerabilities with escalated exploit code maturity
IoCs provide direct evidence of exploitation, but are not the only sign of threats. Another signal is when there is active research for how to exploit a vulnerability: Exploit code of a vulnerability becomes available or has escalated maturity.
Table 2. The number of vulnerabilities with escalated maturity of exploit code in the next 28 days by VPR (top) and CVSSv3 (bottom)
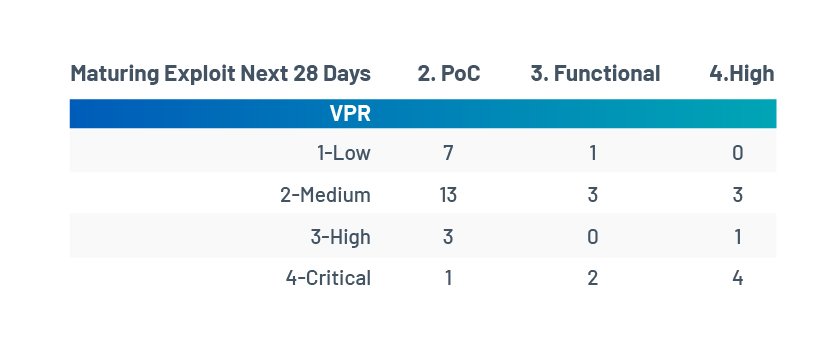
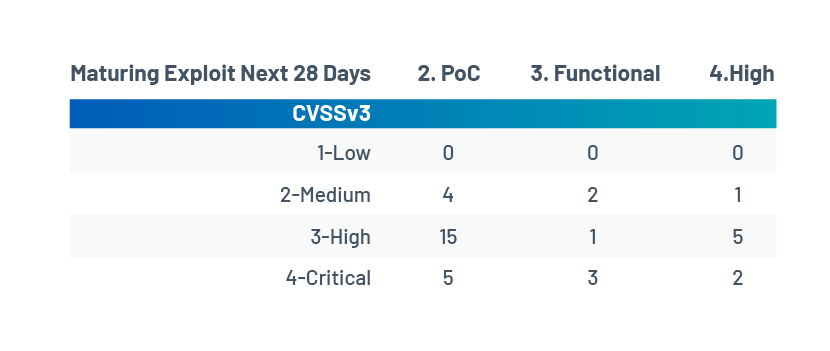
Table 2 compares the efficacy of VPR with CVSS for capturing vulnerabilities where exploit code maturity escalated to PoC, functional or high, respectively, in the 28 days after VPR scoring. These are the vulnerabilities under active research of exploitation in this period. The rows in the tables relate to vulnerability criticality. The columns relate to exploit code maturity. The values in the cells represent the number of vulnerabilities with escalated or maturing exploit code in the 28 days after VPR scoring. For example, four vulnerabilities rated as VPR Critical have their exploit code maturity escalated to high in the next 28 days. Here’s our analysis:
- VPR has a higher hit rate than CVSSv3 when predicting vulnerabilities for which exploit code maturity will escalate to high in the 28 days after the VPR scoring. Of the eight vulnerabilities in this category, VPR rated four as Critical compared to two for CVSS.
- Not all levels of exploit code maturity are treated equally by VPR. VPR Critical emphasizes vulnerabilities with higher maturity levels:
- 50% (four out of eight) of the vulnerabilities escalated to high are rated as VPR Critical.
- 30% (two out of six) of the vulnerabilities escalated to functional are rated as VPR Critical.
- Only 4% (one out of 24) of the vulnerabilities escalated to PoC are rated as VPR Critical.
- Contrast this with CVSSv3 Critical, which contains a mix of maturity levels: 25% for high, 50% for functional and 21% for PoC.
- CVSSv3 has higher coverage in capturing vulnerabilities with escalating exploit code: More vulnerabilities rated CVSSv3 Critical and High have higher exploit code maturity than VPR Critical and High:
- In total, 31 vulnerabilities with escalating exploit code maturity are rated CVSSv3 Critical or High. Among them, exploits of seven vulnerabilities are escalated to high maturity, four to functional and 20 to PoC.
- In total, 11 vulnerabilities with escalating exploit code maturity are rated VPR Critical or High. Among them, exploits of five vulnerabilities are escalated to high maturity, two to functional and four to PoC.
So, in circumstances where patching vulnerabilities with escalating exploit code is the goal, a good strategy would be to first prioritize based on VPR Critical to get a high hit rate, and secondly by CVSS High and Critical, in turn, to increase coverage.
Summary
In this post, we have discussed VPR and what makes it more than just another CVSS. In summary:
- VPR is designed for vulnerability remediation prioritization. Its scoring formula takes into account both technical characteristics and threat intelligence.
- VPR is more efficient than CVSSv3 at predicting vulnerabilities under threat:
- For hardening your network against emerging exploitation in the wild, prioritizing vulnerabilities based on ~400 VPR Critical can reach the same level of efficacy as ~9,000 CVSSv3 Critical.
- For hardening your network against vulnerabilities with known exploit code, prioritizing vulnerabilities based on ~1,500 VPR Critical and High can reach the same level of efficacy as 33,000 CVSSv3 Critical and High.
- For hardening your network against vulnerabilities with escalating exploit code maturity, first prioritize using VPR Critical vulnerabilities to get a high hit rate, and then by CVSS High and Critical to increase coverage.
Get more information
- Start your free trial now to see VPR in action – available in Tenable.io (in the cloud) and Tenable.sc (on-premises)
- Learn more about Tenable Predictive Prioritization and VPR
References
[CMU2019] J.M. Spring, E. Hatleback, A. Householder, A. Manion, D. Shick, Towards Improving CVSS, White Paper, 2019
[CVSSv3] Common Vulnerability Scoring System version 3.1: Specification Document
Learn more
Related articles


- SecurityCenter
- Tenable Vulnerability Management
- Tenable Vulnerability Management (DO NOT USE)
- Threat Intelligence
- Vulnerability Management
Tenable One
Request a demo
The world’s leading AI-powered exposure management platform.
Thank You
Thank you for your interest in Tenable One.
A representative will be in touch soon.
Form ID: 7469
Form Name: one-eval
Form Class: c-form form-panel__global-form c-form--mkto js-mkto-no-css js-form-hanging-label c-form--hide-comments
Form Wrapper ID: one-eval-form-wrapper
Confirmation Class: one-eval-confirmform-modal
Simulate Success