by Steve Tilson
June 25, 2014

Organizations can use qualitative analysis as a tool to assist in assessing overall security risk to their environment. A qualitative risk analysis is simply a process that assesses the priority of an identified risk and the probability that risk will occur. This dashboard provides a qualitative risk measurement for all vulnerabilities found and easily referenced by a color coded CVSS score.
The Forum of Incident Response and Security Teams (FIRST) created the Common Vulnerability Scoring System (CVSS) to standardize the methodology of analyzing risk. The CVSS provides a framework for assessing the risk of discovered vulnerabilities. CVSS is composed of the Base, Temporal and the Environmental metric groups.
This dashboard focuses on the Base Metric group which represents specified characteristics for vulnerabilities that will remain constant over time and in the environment. The Base Metric group is comprised of six values used to qualitatively assess the risk of a vulnerability. There are two sub groupings of the Base Metric, the access value group and the impact value group. The access value assigns a risk level based on the vector used to gain access to the target system. The access values include:
- Access Vector, which reflects the methods used to exploit a vulnerability
- Access Complexity, which measures difficulty or complexity of that an attacker faces to exploit a vulnerability once access is obtained
- Authentication, which measures how many authentication repetitions are required to successfully exploit a vulnerability
The impact values group use the CIA triad (Confidentiality, Integrity, Availability) to assign an impact score to a vulnerability. The impact values include:
- Confidentiality Impact: measures the confidentiality after a successful exploit, meaning how well access by unauthorized users can be prevented and limiting access to information that could further aid the covert attack.
- Integrity Impact: measures to what extent the information stored on the system is impacted when successfully exploited, meaning the impact to the accuracy and reliability the information stored on the victim system.
- Availability Impact: measures how system resources are affected by the vulnerability being exploited, some attacks can consume CPU, network, or other resources available to target system.
Managers of all levels can use this dashboard in Tenable.sc CV™ to gain a base view of the level of cyber risk associated within their environment. Components found in this dashboard can also provide managers with a measurement of timing towards mitigation efforts. Further detailed information found with Tenable.sc CV™ can assist in planning and adjustments for current mitigation efforts that may provide lower levels of risk and better securing of the environment. Tenable.sc CV™ use of CVSS scoring provides a recognized standard of assessment for vulnerabilities. This dashboard will focus on the CVSS scores of 4.0 to 10.0.
The dashboard and its components are available in the Tenable.sc Feed, a comprehensive collection of dashboards, reports, assurance report cards and assets. The dashboard can be easily located in the Tenable.sc Feed under the category Threat Detection & Vulnerability Assessments.
The dashboard requirements are:
- Tenable.sc 5.2.0
- Nessus 8.5.1
- NNM 5.9.1
- LCE 6.0.0
Tenable's Tenable.sc Continuous View® (Tenable.sc CV™) provides continuous network monitoring, vulnerability identification and security monitoring. Tenable.sc CV™ is continuously updated with information about advanced threats, zero-day vulnerabilities and new types of regulatory compliance configuration audit files. Tenable constantly analyzes information from unique sensors, delivering continuous visibility and critical context, and enabling decisive action that transforms a security program from reactive to proactive. Active scanning periodically examines the applications on the systems, the running processes and services, web applications and configuration settings. Passive listening provides real-time discovery of vulnerabilities on operating systems, protocols, network services, wireless devices, web applications, and critical infrastructure. Tenable.sc CV™ provides an organization with the most comprehensive view of the network and actionable information to support mitigation efforts and reduce cyber risk. Managers can assess a base level of risk to vulnerabilities found with this qualitative analysis in Tenable.sc CV™. Tenable enables powerful, yet non-disruptive, continuous monitoring that will provide organizations with the information needed to reduce risk within the enterprise.
This dashboard contains the following components:
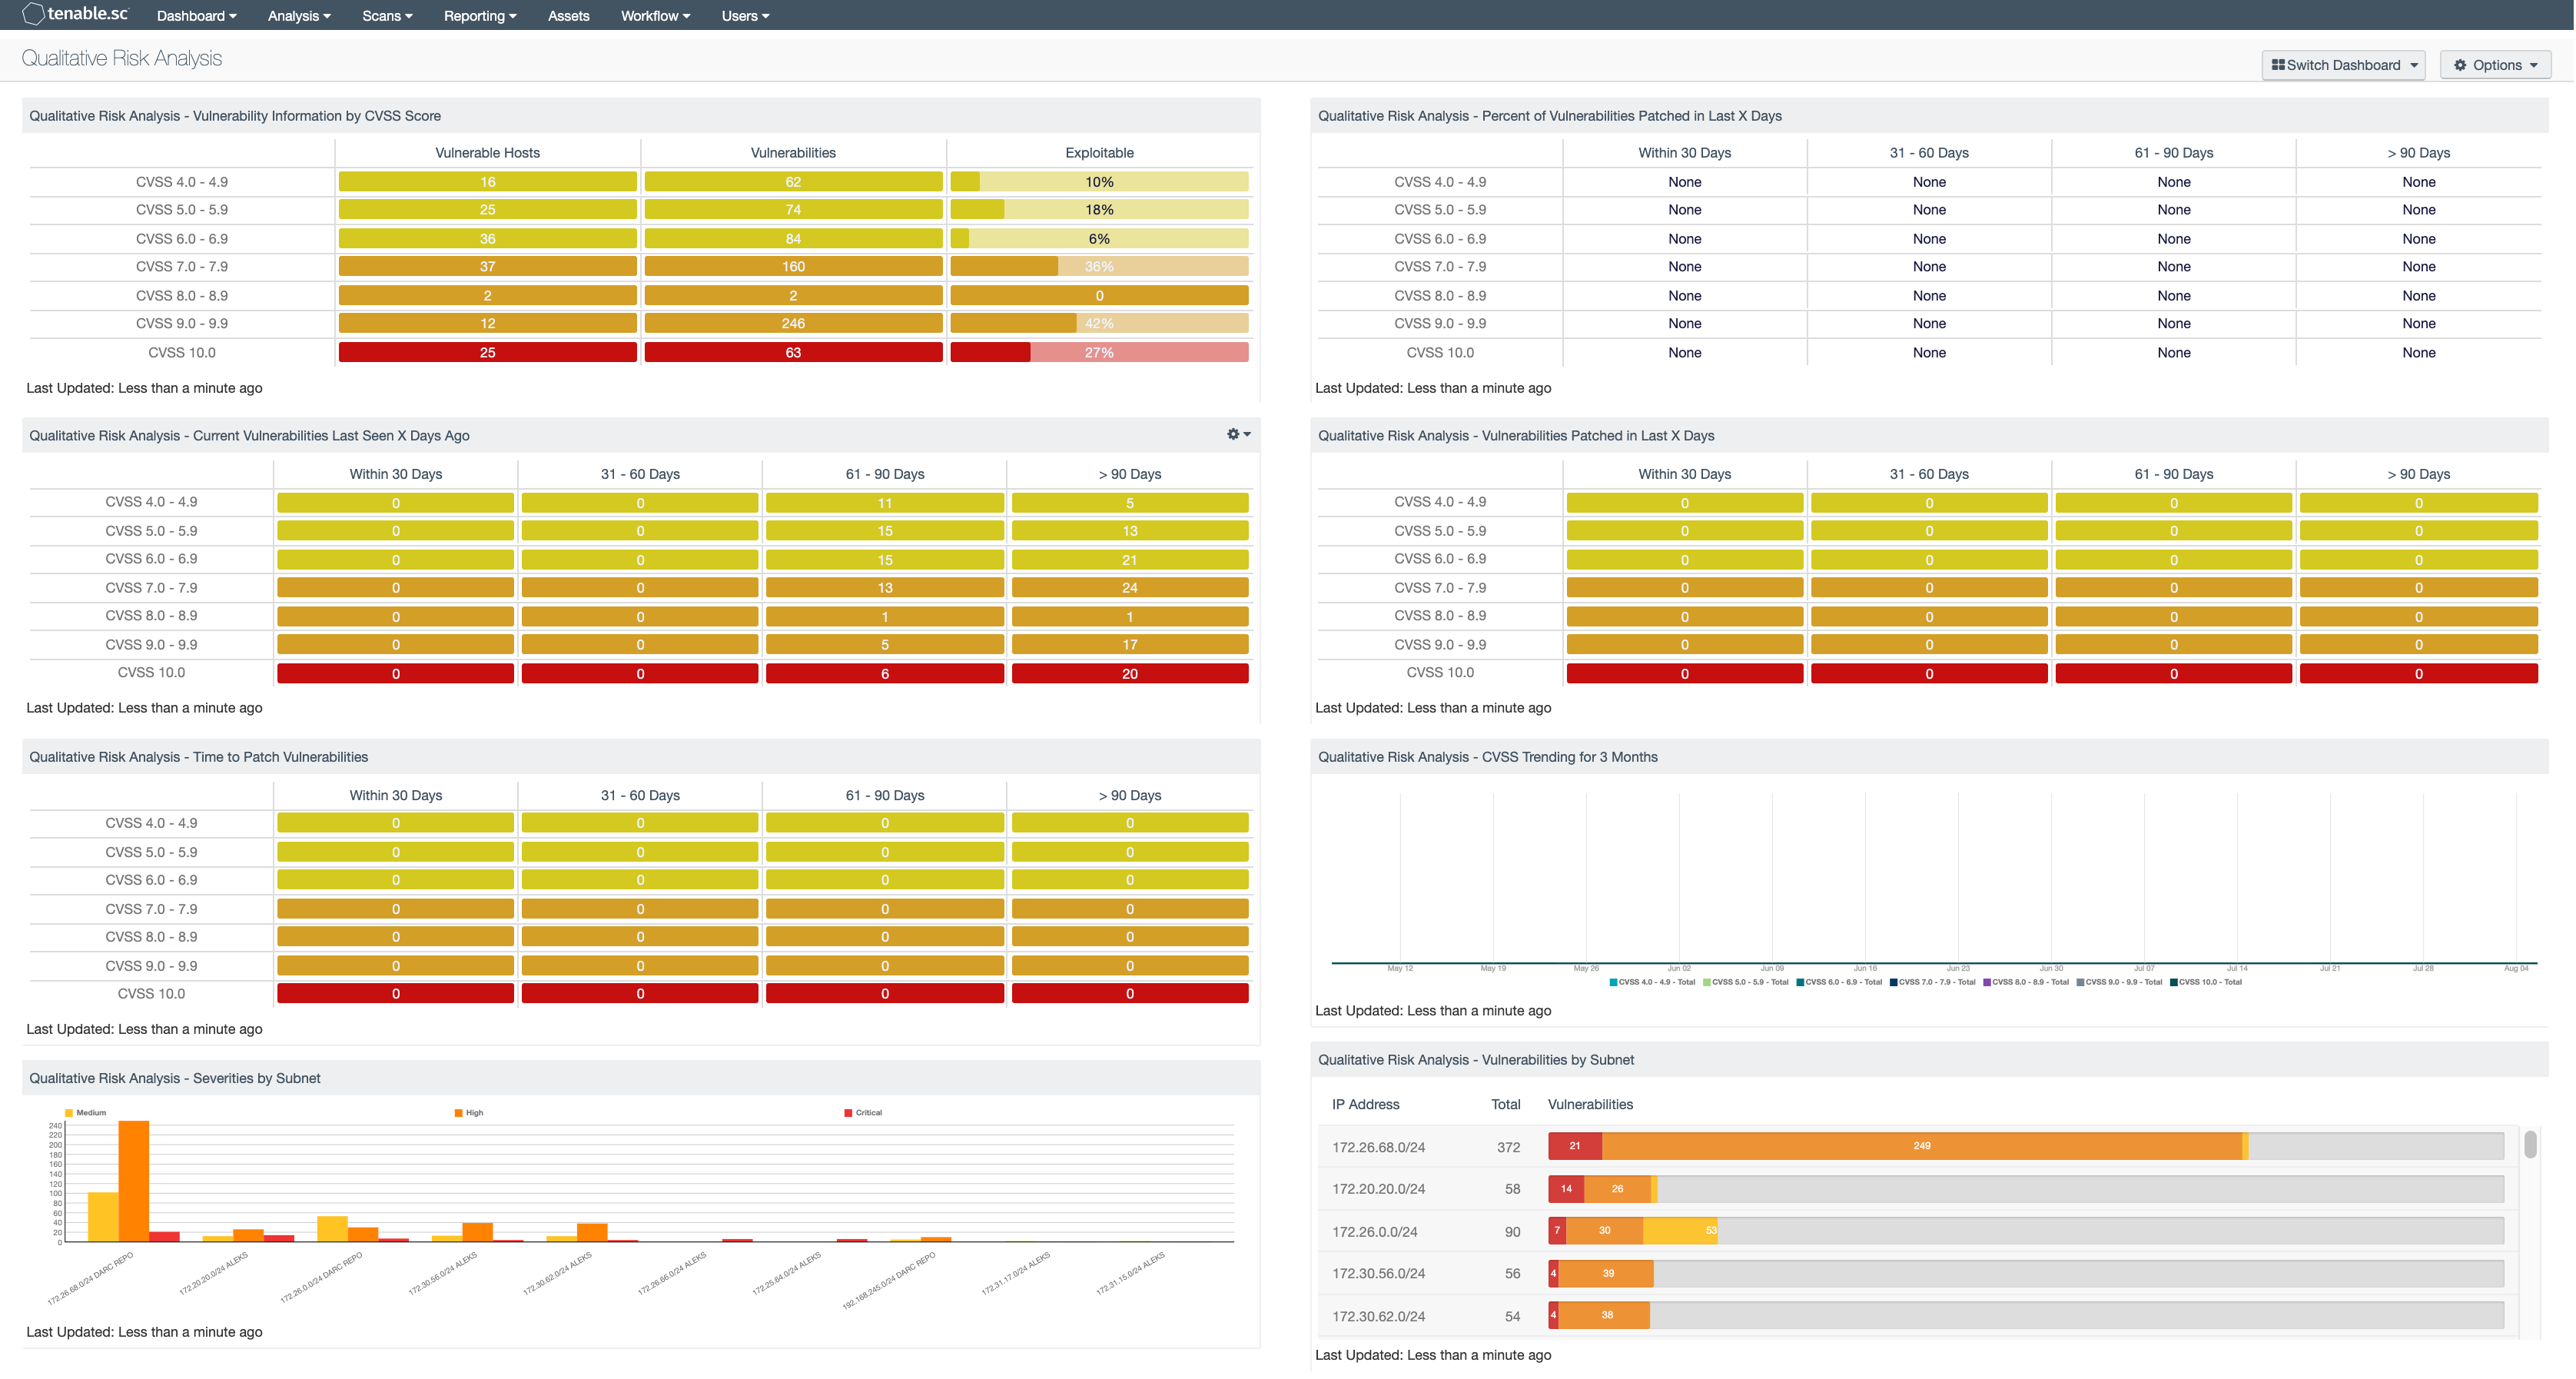
Qualitative Risk Analysis - Vulnerability Information by CVSS Score: The Vulnerability Information by CVSS Score matrix provides the cumulative number of vulnerable hosts, the number of vulnerabilities and the percentage of exploitable vulnerabilities.
Qualitative Risk Analysis - Current Vulnerabilities Last Seen X Days Ago: The Current Vulnerabilities Last Seen X Days Ago table displays the cumulative hosts with vulnerabilities for each CVSS Score range that was created.
Qualitative Risk Analysis - Time to Patch Vulnerabilities: The Time to Patch Vulnerabilities table displays the CVSS Score range 4.0 - 4.9, 5.0 - 5.9, 6.0 - 6.9, 7.0 - 7.9, 8.0 - 8.9, 9.0 - 9.9, and 10.
Qualitative Risk Analysis - Severities by Subnet: The Severities by Subnet chart provides the top ten IP subnets separated by severities of vulnerabilities within each subnet range.
Qualitative Risk Analysis - Percent of Vulnerabilities Patched in Last X Days: The Percent of Vulnerabilities Patched in Last X Days table tracks patched vulnerabilities and detects the time required to apply the patch.
Qualitative Risk Analysis - Vulnerabilities Patched in Last X Days: The Vulnerabilities Patched in Last X Days table displays the number of hosts with vulnerabilities that were patched in a certain amount of days.
Qualitative Risk Analysis - CVSS Trending for 3 Months: The CVSS Trending for 3 Months chart provides an overview of the different CVSS Scores over the last 3 months.
Qualitative Risk Analysis - Vulnerabilities by Subnet: The Vulnerabilities by Subnet table provides a cumulative number of medium, high, and critical vulnerabilities per the top ten IP subnets.